Net Profit Forecasting
Overview:
This notebook aimed is to demonstrate the solution for simple regression problem, predict net profit given a set of attributes, first I start with simple EDA understand the data numerical and categorical distributions. Then I fit simple statistical model followed by linear regression and more complex one. each model includes scoring metrics and explanations. Finally, I communicate final finding of prediction of the provided Out-of-sample test set and the including factors or attributes that decided the final predictions using shapley values.
- Basic EDA.
- Feature Engineering.
- Statistical Model.
- Baseline Model
- Complex Model.
- Scoring.
- SHAPly Values, Interoperable ML.
# modeling
from sklearn.linear_model import LinearRegression
from lightgbm import LGBMRegressor
from statsmodels.regression.linear_model import OLS
from sklearn.model_selection import train_test_split
from sklearn.model_selection import StratifiedKFold
from sklearn.preprocessing import OneHotEncoder, LabelEncoder

# model diagnosis:
from yellowbrick.model_selection import learning_curve
from yellowbrick.regressor import ResidualsPlot

# Interpretable Machine Learning:
import shap
# helper functions I wrote for this dataset:
from utils import *
import warnings
warnings.filterwarnings('ignore')

# Settings and aesthetics:
cmap_data = plt.cm.Paired
cmap_cv = plt.cm.coolwarm
cmap_data = plt.cm.Paired
cmap_cv = plt.cm.coolwarm

# Some basic settings here:
pd.set_option('display.max_rows', 500)
pd.set_option('display.max_columns', 500)
pd.set_option('display.width', 1000)
pd.options.display.max_columns = 30
EDA
modeling_data = pd.read_csv("../../Data/labeled_dataset.csv")
modeling_data.set_index("index", inplace=True)
modeling_data.head()
| Age | Monthly premium | Socioeconomic category | Monthly kilometers | Coefficient bonus malus | Vehicle type | CRM score | Standard of living | Brand | Yearly income | Credit score | Yearly maintenance cost | Net profit | |
|---|---|---|---|---|---|---|---|---|---|---|---|---|---|
| index | |||||||||||||
| 0 | 58.0 | 40.0 | Student | 973 | 106 | SUV | 164 | 3762 | Peugeot | 20420 | 309 | 801 | 54.998558 |
| 1 | 26.0 | 27.0 | Labor worker | 637 | 95 | 5 doors | 126 | 3445 | Renault | 25750 | 135 | 667 | 7.840930 |
| 2 | 27.0 | 26.0 | Office worker | 978 | 136 | SUV | 153 | 986 | Renault | 6790 | 786 | 696 | 46.078889 |
| 3 | 22.0 | 8.0 | Student | 771 | 96 | 3 doors | 111 | 2366 | Peugeot | 15140 | 320 | 765 | -11.048213 |
| 4 | 60.0 | 20.0 | Unemployed | 758 | 101 | 3 doors | 149 | 1441 | Peugeot | 12850 | 287 | 808 | 1.180078 |
modeling_data.info()
<class 'pandas.core.frame.DataFrame'>
Int64Index: 1000 entries, 0 to 999
Data columns (total 13 columns):
 #   Column                   Non-Null Count  Dtype
---  ------                   --------------  -----
 0   Age                      983 non-null    float64
 1   Monthly premium          989 non-null    float64
 2   Socioeconomic category   1000 non-null   object
 3   Monthly kilometers       1000 non-null   int64
 4   Coefficient bonus malus  1000 non-null   int64
 5   Vehicle type             1000 non-null   object
 6   CRM score                1000 non-null   int64
 7   Standard of living       1000 non-null   int64
 8   Brand                    948 non-null    object
 9   Yearly income            1000 non-null   int64
 10  Credit score             1000 non-null   int64
 11  Yearly maintenance cost  1000 non-null   int64
 12  Net profit               1000 non-null   float64
dtypes: float64(3), int64(7), object(3)
memory usage: 109.4+ KB
modeling_data.isnull().sum().to_frame().style.background_gradient(cmap='summer')
| 0 | |
|---|---|
| Age | 17 |
| Monthly premium | 11 |
| Socioeconomic category | 0 |
| Monthly kilometers | 0 |
| Coefficient bonus malus | 0 |
| Vehicle type | 0 |
| CRM score | 0 |
| Standard of living | 0 |
| Brand | 52 |
| Yearly income | 0 |
| Credit score | 0 |
| Yearly maintenance cost | 0 |
| Net profit | 0 |
# fill nan with other Brand types:
modeling_data["Brand"].fillna("other", inplace=True)
modeling_data = modeling_data[modeling_data["Monthly premium"].notna()]
modeling_data.columns.tolist()
    ['Age',
     'Monthly premium',
     'Socioeconomic category',
     'Monthly kilometers',
     'Coefficient bonus malus',
     'Vehicle type',
     'CRM score',
     'Standard of living',
     'Brand',
     'Yearly income',
     'Credit score',
     'Yearly maintenance cost',
     'Net profit']
plt.figure(figsize=(10,6))
sns.set(style="whitegrid", font_scale=1.2)
chart = sns.countplot(x='Brand',
                      hue='Socioeconomic category',
                      data=modeling_data,
                      palette='deep')
chart.set_title('Histogram for Categorical Variables', fontsize=16, color='firebrick')
plt.show()

sns.set(style="whitegrid")
plt.figure(figsize=(11,7))
chart = sns.countplot(x='Brand',
                      hue='Vehicle type',
                      data=modeling_data,
                      palette='deep')
chart.set_title('Count-plot for Categorical Variables', fontsize=16, color='firebrick')
plt.show()

plt.figure(figsize=(11,7))
sns.boxplot(data=modeling_data[["Age",
                                "Monthly premium",
                                "Coefficient bonus malus",
                                "CRM score",
                                "Net profit"]])
plt.title('Box-plots for Selected Variables', fontsize=16, color='firebrick')
plt.show()

# drop extreme outlier from the above observations:
modeling_data = modeling_data[modeling_data["CRM score"] < 254]
modeling_data = modeling_data[(modeling_data["Age"] < 124) & (modeling_data["Age"] > 0)]
# no warning outlier for credit score, monthly kilometers and yearly maintenance cost:
plt.figure(figsize=(11,7))
sns.boxplot(data=modeling_data[["Monthly kilometers", "Credit score"]])
plt.title('Box-plots for Selected Variables', fontsize=16, color='firebrick')
plt.grid(False)
plt.show()

plt.figure(figsize=(11,7))
sns.boxplot(x=modeling_data["Yearly maintenance cost"], color='aqua')
plt.title('Boxplot for Yearly Maintenance Cost', fontsize=16, color='firebrick')
plt.show()

plt.figure(figsize=(11,7))
sns.boxplot(x=modeling_data["Yearly income"], color='lightseagreen')
plt.title('Boxplot for Yearly Income', fontsize=16, color='firebrick')
plt.show()

sns.set(style="whitegrid", font_scale=1.2)
plt.figure(figsize=(8, 5))
sns.boxplot(x=modeling_data["Standard of living"])
plt.xlabel("Standard of living")
plt.ylabel("Values")
plt.title("Box Plot - Standard of living")
plt.show()

sns.set(style="whitegrid", font_scale=1.2)
plt.figure(figsize=(8, 6))
sns.histplot(data=modeling_data, x="Yearly income", hue="Socioeconomic category", multiple="stack")
plt.xlabel("Yearly income")
plt.ylabel("Count")
plt.title("Yearly income per Socioeconomic Category")
plt.show()

sns.set(style="whitegrid", font_scale=1.2)
plt.figure(figsize=(8, 6))
sns.histplot(data=modeling_data, x="Yearly income", hue="Vehicle type", multiple="stack")
plt.xlabel("Yearly income")
plt.ylabel("Count")
plt.title("Vehicle Type Per Yearly Income")
plt.show()

sns.set(style="whitegrid", font_scale=1.2)
plt.figure(figsize=(8, 5))
sns.boxplot(x=modeling_data["Standard of living"])
plt.xlabel("Standard of living")
plt.ylabel("Values")
plt.title("Box Plot - Standard of living")
plt.show()

sns.set(style="whitegrid", font_scale=1.2)
plt.figure(figsize=(8, 6))
sns.histplot(data=modeling_data, x="Yearly income", hue="Socioeconomic category", element="step")
plt.xlabel("Yearly income")
plt.ylabel("Count")
plt.title("Yearly income per Socioeconomic Category")
plt.show()

sns.set(style="whitegrid", font_scale=1.2)
plt.figure(figsize=(8, 6))
sns.histplot(data=modeling_data, x="Yearly income", hue="Vehicle type", multiple="stack")
plt.xlabel("Yearly income")
plt.ylabel("Count")
plt.title("Vehicle Type Per Yearly Income")
plt.show()

sns.set(style="whitegrid", font_scale=1.2)
plt.figure(figsize=(8, 5))
sns.histplot(data=modeling_data, x="Yearly income", hue="Brand", multiple="stack")
plt.xlabel("Yearly income")
plt.ylabel("Count")
plt.title("Brand Type Per Yearly Income")
plt.show()

sns.set(style="whitegrid", font_scale=1.2)
plt.figure(figsize=(8, 5))
sns.histplot(data=modeling_data, x="Net profit", hue="Socioeconomic category", multiple="stack")
plt.xlabel("Net profit")
plt.ylabel("Count")
plt.title("Net Profit per Socioeconomic Category")
plt.show()

sns.set(style="whitegrid", font_scale=1.2)
plt.figure(figsize=(8, 5))
sns.histplot(data=modeling_data, x="Net profit", hue="Vehicle type", multiple="stack")
plt.xlabel("Net profit")
plt.ylabel("Count")
plt.title("Net Profit Distribution Per Vehicle Type")
plt.show()

sns.set(style="whitegrid", font_scale=1.2)
plt.figure(figsize=(8, 5))
sns.histplot(data=modeling_data, x="Net profit", hue="Brand", multiple="stack")
plt.xlabel("Net profit")
plt.ylabel("Count")
plt.title("Net Profit per Brand")
plt.show()

Observations:
- No warning outliers seen in the data except for yearly income, CRM score and Age.
- Numerical data are normally distributed.
Encode categorical variables and clean data for modeling:
# categorize your variables here:
categories = [
    'Brand',
    'Vehicle type',
    'Socioeconomic category',
]
modeling_data_visualization = pd.get_dummies(modeling_data,
                               columns=categories,
                               drop_first=True)
modeling_data = pd.get_dummies(
                               modeling_data,
                               columns=categories,
                               drop_first=True
                               )
# rearrange columns:
ordered_corr_columns = modeling_data_visualization.copy()
ordered_corr_columns = ordered_corr_columns[['Age',
                                             'Monthly premium',
                                             'Monthly kilometers',
                                             'Coefficient bonus malus',
                                             'CRM score',
                                             'Standard of living',
                                             'Yearly income',
                                             'Credit score',
                                             'Yearly maintenance cost',
                                             'Brand_Citroen',
                                             'Brand_Opel',
                                             'Brand_Peugeot',
                                             'Brand_Renault',
                                             'Brand_Toyota',
                                             'Brand_Volkswagen',
                                             'Brand_other',
                                             'Vehicle type_3 doors',
                                             'Vehicle type_5 doors',
                                             'Vehicle type_SUV',
                                             'Vehicle type_utility',
                                             'Socioeconomic category_Labor worker',
                                             'Socioeconomic category_Office worker',
                                             'Socioeconomic category_Self employed',
                                             'Socioeconomic category_Student',
                                             'Socioeconomic category_Unemployed',
                                             'Net profit'
                                             ]]
plt.figure(figsize=(15, 15))
corr = ordered_corr_columns.corr()
corr_top = corr.index
sns.heatmap(modeling_data_visualization[corr_top].corr(),
            vmax=1.0,
            vmin=-1.0,
            linewidths=0.1,
            annot=True,
            annot_kws={"size": 8},
            square=True, cbar=False);

corr = ordered_corr_columns.corr()
plt.figure(figsize=(15, 15))
sns.heatmap(corr[(corr >= 0.1)],
            vmax=1.0,
            vmin=-1.0,
            linewidths=0.1,
            annot=True,
            annot_kws={"size": 8},
            square=True,
            cbar=False)

corr = ordered_corr_columns.corr()
plt.figure(figsize=(15, 15))
sns.heatmap(corr[(corr <= -0.1)],
            vmax=1.0,
            vmin=-1.0,
            linewidths=0.1,
            annot=True,
            annot_kws={"size": 8},
            square=True,
            cbar=False);

fig, ax = plt.subplots(figsize=(8, 8))
sns.heatmap(modeling_data_visualization.corr()[["Net profit"]].sort_values("Net profit"),
            vmax=1,
            vmin=-1,
            annot=True,
            ax=ax)
ax.invert_yaxis()

Observations:
- There is not any warning high correlation between target variable and independent variables.
- Multi-collinearity between Standard of living and yearly income, CRM score and Coefficient bonus malus, they might be problematic for linear models interpretation.
- There are few independent variables can be used for fitting model that correlate positively/negatively with Net profit.
- There is enough signals in the data simple model with fewer coefficient would generalize on unseen data.
Simple Model:
Features = modeling_data.columns.tolist()
Features.remove("Net profit")
Ys = modeling_data["Net profit"]
Xs = modeling_data[Features]
Multi-collinearity Check VIF:
calculate_vif(Xs).style.background_gradient(cmap='summer')
| variables | VIF | |
|---|---|---|
| 0 | Age | 63.237779 |
| 1 | Monthly premium | 3.050082 |
| 2 | Monthly kilometers | 7.627456 |
| 3 | Coefficient bonus malus | 432.507997 |
| 4 | CRM score | 718.673947 |
| 5 | Standard of living | 110.184626 |
| 6 | Yearly income | 115.704855 |
| 7 | Credit score | 3.866306 |
| 8 | Yearly maintenance cost | 35.804418 |
| 9 | Brand_Opel | 1.240398 |
| 10 | Brand_Peugeot | 2.379924 |
| 11 | Brand_Renault | 2.191521 |
| 12 | Brand_Toyota | 1.432597 |
| 13 | Brand_Volkswagen | 1.562894 |
| 14 | Brand_other | 1.252540 |
| 15 | Vehicle type_5 doors | 2.692416 |
| 16 | Vehicle type_SUV | 2.464803 |
| 17 | Vehicle type_utility | 1.374975 |
| 18 | Socioeconomic category_Office worker | 2.635837 |
| 19 | Socioeconomic category_Self employed | 1.248430 |
| 20 | Socioeconomic category_Student | 2.359763 |
| 21 | Socioeconomic category_Unemployed | 1.440898 |
fixed_Xs = Xs.drop(["Standard of living",
                    "Coefficient bonus malus",
                    "CRM score",
                    "Yearly maintenance cost"], axis=1)
calculate_vif(fixed_Xs).style.background_gradient(cmap='summer')
| variables | VIF | |
|---|---|---|
| 0 | Age | 7.099762 |
| 1 | Monthly premium | 2.836646 |
| 2 | Monthly kilometers | 6.413401 |
| 3 | Yearly income | 3.427115 |
| 4 | Credit score | 3.583600 |
| 5 | Brand_Opel | 1.204267 |
| 6 | Brand_Peugeot | 2.175342 |
| 7 | Brand_Renault | 2.026626 |
| 8 | Brand_Toyota | 1.377058 |
| 9 | Brand_Volkswagen | 1.472219 |
| 10 | Brand_other | 1.225380 |
| 11 | Vehicle type_5 doors | 2.558872 |
| 12 | Vehicle type_SUV | 2.345649 |
| 13 | Vehicle type_utility | 1.333014 |
| 14 | Socioeconomic category_Office worker | 2.430892 |
| 15 | Socioeconomic category_Self employed | 1.226225 |
| 16 | Socioeconomic category_Student | 2.203248 |
| 17 | Socioeconomic category_Unemployed | 1.386635 |
simple_model = LinearRegression().fit(fixed_Xs, Ys)
simple_model.score(fixed_Xs, Ys)
0.8834266631920002
coef = get_regressor_coefficients(simple_model, fixed_Xs.columns.tolist())
coefficient_plot(coef.values(), coef.keys())

est = OLS(Ys, Xs).fit()
print(est.summary())
                                 OLS Regression Results
=======================================================================================
Dep. Variable:             Net profit   R-squared (uncentered):                   0.930
Model:                            OLS   Adj. R-squared (uncentered):              0.929
Method:                 Least Squares   F-statistic:                              569.0
Date:                Mon, 26 Jun 2023   Prob (F-statistic):                        0.00
Time:                        15:46:44   Log-Likelihood:                         -3203.3
No. Observations:                 958   AIC:                                      6451.
Df Residuals:                     936   BIC:                                      6558.
Df Model:                          22
Covariance Type:            nonrobust
========================================================================================================
                                           coef    std err          t      P>|t|      [0.025      0.975]
--------------------------------------------------------------------------------------------------------
Age                                      0.2148      0.048      4.474      0.000       0.121       0.309
Monthly premium                         -0.0320      0.017     -1.875      0.061      -0.066       0.002
Monthly kilometers                       0.0072      0.001      7.597      0.000       0.005       0.009
Coefficient bonus malus                 -0.0124      0.046     -0.270      0.787      -0.103       0.078
CRM score                                0.0156      0.044      0.354      0.724      -0.071       0.102
Standard of living                       0.0003      0.000      0.566      0.572      -0.001       0.001
Yearly income                           -0.0003   6.95e-05     -3.946      0.000      -0.000      -0.000
Credit score                            -0.0010      0.001     -1.340      0.181      -0.003       0.000
Yearly maintenance cost                 -0.0139      0.002     -8.276      0.000      -0.017      -0.011
Brand_Opel                              -1.5706      1.151     -1.364      0.173      -3.830       0.689
Brand_Peugeot                           -1.7943      0.666     -2.694      0.007      -3.101      -0.487
Brand_Renault                           -0.7600      0.683     -1.113      0.266      -2.100       0.580
Brand_Toyota                            -1.7598      0.905     -1.943      0.052      -3.537       0.017
Brand_Volkswagen                        -2.6734      0.830     -3.220      0.001      -4.303      -1.044
Brand_other                             -2.2858      1.109     -2.062      0.039      -4.461      -0.110
Vehicle type_5 doors                    18.3364      0.600     30.537      0.000      17.158      19.515
Vehicle type_SUV                        37.8587      0.621     60.937      0.000      36.639      39.078
Vehicle type_utility                    57.4583      0.921     62.415      0.000      55.652      59.265
Socioeconomic category_Office worker    -0.2975      0.620     -0.480      0.631      -1.514       0.919
Socioeconomic category_Self employed    -1.5587      1.130     -1.379      0.168      -3.776       0.659
Socioeconomic category_Student           3.5937      0.633      5.676      0.000       2.351       4.836
Socioeconomic category_Unemployed        3.9310      0.887      4.431      0.000       2.190       5.672
==============================================================================
Omnibus:                       15.750   Durbin-Watson:                   1.959
Prob(Omnibus):                  0.000   Jarque-Bera (JB):               24.111
Skew:                          -0.131   Prob(JB):                     5.81e-06
Kurtosis:                       3.731   Cond. No.                     2.28e+05
==============================================================================

Notes:
[1] R² is computed without centering (uncentered) since the model does not contain a constant.
[2] Standard Errors assume that the covariance matrix of the errors is correctly specified.
[3] The condition number is large, 2.28e+05. This might indicate that there are
strong multicollinearity or other numerical problems.
statistical_results_as_frame = get_dataframe_from_summary(est)
statistical_results_as_frame[statistical_results_as_frame["P>|t|"] <= 0.000].
style.background_gradient(cmap='summer')
| coef | std err | t | P>|t| | [0.025 | 0.975] | |
|---|---|---|---|---|---|---|
| Age | 0.214800 | 0.048000 | 4.474000 | 0.000000 | 0.121000 | 0.309000 |
| Monthly kilometers | 0.007200 | 0.001000 | 7.597000 | 0.000000 | 0.005000 | 0.009000 |
| Yearly income | -0.000300 | 0.000069 | -3.946000 | 0.000000 | -0.000000 | -0.000000 |
| Yearly maintenance cost | -0.013900 | 0.002000 | -8.276000 | 0.000000 | -0.017000 | -0.011000 |
| Vehicle type_5 doors | 18.336400 | 0.600000 | 30.537000 | 0.000000 | 17.158000 | 19.515000 |
| Vehicle type_SUV | 37.858700 | 0.621000 | 60.937000 | 0.000000 | 36.639000 | 39.078000 |
| Vehicle type_utility | 57.458300 | 0.921000 | 62.415000 | 0.000000 | 55.652000 | 59.265000 |
| Socioeconomic category_Student | 3.593700 | 0.633000 | 5.676000 | 0.000000 | 2.351000 | 4.836000 |
| Socioeconomic category_Unemployed | 3.931000 | 0.887000 | 4.431000 | 0.000000 | 2.190000 | 5.672000 |
X_train, X_test, y_train, y_test = train_test_split(fixed_Xs,
                                                    Ys,
                                                    test_size=0.3,
                                                    random_state=10101)
visualizer = LearningCurve(
    simple_model, cv=20, scoring='r2',
    n_jobs=4
)
visualizer.fit(fixed_Xs,Ys )
visualizer.show()

<Axes: title={'center': 'Learning Curve for LinearRegression'}, xlabel='Training Instances', ylabel='Score'>
model = LinearRegression()
visualizer = ResidualsPlot(model)
visualizer.fit(X_train, y_train)
visualizer.score(X_test, y_test)
visualizer.show()

<Axes: title={'center': 'Residuals for LinearRegression Model'}, xlabel='Predicted Value', ylabel='Residuals'>
Observations:
- As suspected Standard of living, yearly income and Coefficient bonus malus has strong correlation with other independent variables, they can be predicted by other independent variables.
- As suspected model is stable against few features, after dropping independent variables with high VIF scores 0.886
- P-values: Socioeconomic: student, unemployed, vehicle types 3,5 suv and utility, yearly income, age and monthly kilometers suggest strong significant relation between them and target variable on large populations.
- Brand Renault and Toyota P-values suggest strong influence on target variable compared to other brands.
- Residuals: indicates a good fit for linear model, predicted values greater than 40 are misfit for compared to the training samples.
- unexpected high p-value for Socioeconomic Self employed brand Volkswagen, Credit score and Yearly maintenance cost independent variables.
- Model tend to generalize when applying cross-validation of 20 folds, testing and training scores are matching after 20 folds/iterations.
Complex Model:
- From the above observation we have constructed a stable model with simple features and linear repressor, I would vote for simplified models since they are easy to explain to stakeholders and easier to productionize compared to more complex model with high variance.
- The fact that the data is synthetic and generated from known function makes it even easier to fit a model against normally distributed target variables.
- Tho it’s not required for this particular dataset but the demonstration below will help explain what is happening behind the scene why applying a particular predictions.
complex_model = LGBMRegressor(random_state=np.random.RandomState().get_state()[1][0])
complex_model.fit(X_train, y_train)
LGBMRegressor(random_state=2147483648)In a Jupyter environment, please rerun this cell to show the HTML representation or trust the notebook.
On GitHub, the HTML representation is unable to render, please try loading this page with nbviewer.org.
LGBMRegressor(random_state=2147483648)
{"training score": complex_model.score(X_train, y_train),
 "testing score": complex_model.score(X_test, y_test)}
{'training score': 0.9954600929824392, 'testing score': 0.9744489721140687}
visualizer = LearningCurve(
    complex_model,
    cv=20,
    scoring='r2',
    n_jobs=4
)
visualizer.fit(fixed_Xs,Ys )
visualizer.show()

<Axes: title={'center': 'Learning Curve for LGBMRegressor'}, xlabel='Training Instances', ylabel='Score'>
visualizer = ResidualsPlot(complex_model)
visualizer.fit(X_train, y_train)
visualizer.score(X_test, y_test)
visualizer.show()

<Axes: title={'center': 'Residuals for LGBMRegressor Model'}, xlabel='Predicted Value', ylabel='Residuals'>
feature_importance_plot(complex_model.feature_importances_, X_train.columns.tolist())

X_train, X_test, y_train, y_test = train_test_split(fixed_Xs,
                                                    Ys,
                                                    test_size=0.3,
                                                    random_state=10101)
complex_model.fit(X_train, y_train)
complex_model.score(X_test, y_test)
0.9744489721140687
{"training score": complex_model.score(X_train, y_train),
 "testing score": complex_model.score(X_test, y_test)}
{'training score': 0.9954600929824392, 'testing score': 0.9744489721140687}
complex_model.fit(fixed_Xs, Ys)
LGBMRegressor(random_state=2147483648)In a Jupyter environment, please rerun this cell to show the HTML representation or trust the notebook.
On GitHub, the HTML representation is unable to render, please try loading this page with nbviewer.org.
LGBMRegressor(random_state=2147483648)
save_model(complex_model, "lgb.pkl")
model saved....
Observations:
- Baseline boosting model is accurate enough to generalize on unseen data.
Predict on unseen Out-of-Sample Data:
golden_data = pd.read_csv("../../Data/scoring_dataset.csv")
golden_data = prepare_out_of_sample_data(golden_data)
predictions = complex_model.predict(golden_data)
predictions
array([ 58.91912859,  49.89491262,  55.44678162, -24.23093475,
       -14.2723258 ,  -8.53386753, -13.64680361,  -9.4624002 ,
        17.76568715,  11.00738228, -19.44384469,  13.65440611,
        10.68901548,  42.35671464,  64.73750346,  31.21405441,
        33.57720901,  66.54627244,  17.34307286, -17.41840316,
        10.57054402,  27.4537283 ,  69.35269097, -12.27879405,
        15.81947529,  -9.96537782,  -3.50549684,  10.60525138,
        29.81544625, -11.33242524,   7.88417464,  11.87869155,
       -21.32857179,  68.10191868,  34.02686042,  12.06295287,
         9.21788335,  11.4395712 , -22.66475147,  10.90707741,
       -11.89317256, -21.2898417 , -16.45650735,  58.73523363,
        11.32063774,  51.41548191,  -6.16929583, -17.21084875,
         8.84313568,  -0.23152295,  16.33390489,  -7.37397323,
        47.33042878,  11.59818288,  35.74334818,  31.79114097,
        31.00438204,  30.59942712,   3.56928081,  32.61225069,
        30.14717748, -16.59407291,  36.6298427 ,  34.46728649,
         5.73856431,   3.28154025, -15.33032491,  23.72479771,
       -13.24799205,   1.69154499,  28.76880574,  45.32716805,
        10.66541024, -16.7040101 ,  13.71867892,  38.66482697,
        64.90888121,  18.33568536,  64.48881502, -12.42543113,
        13.08235257,  32.67607121,   7.26262942,   0.93023009,
       -17.55597795,  52.73909182,  54.72162463,  56.50324747,
       -16.27963481,  -3.71731225,   1.58822318,  46.84579724,
         5.79652318,   4.07176173,  11.33118164,  -9.52012316,
        72.39011481, -13.65875517,  70.09885245,  15.08417505,
         5.53303608,  22.4515763 , -10.57416188,  -7.47169768,
        -3.75537854,  11.61249461,  11.04423492, -14.5301915 ,
        67.9224915 ,  68.21783413,  64.9184886 ,  45.26689911,
        14.07367844, -21.0615744 ,  -9.68622993,   7.99011859,
        70.128609  ,   1.33740385, -12.34573747, -16.53098494,
         0.64245634, -11.7774245 , -17.50944337,  10.03978082,
        12.20080724,   0.85478322, -14.41113003,  17.45473449,
        11.11047532, -13.92590323, -26.3335464 ,  -0.49609702,
        67.70577189,   8.76217364,  11.37061747,  13.94466969,
        31.95999566,  -4.73164322,  -4.78788719,  35.05434567,
       -17.65590835,  11.19294598, -23.46091508, -14.90541622,
        59.80512017,  -4.39993801,  65.87373554, -10.21459077,
         3.34296328,   3.46447491,  18.02436197,  70.92517188,
       -16.13044562,  15.22610701,  67.3571339 ,  31.31605017,
        16.25664797,  65.32404436,  -2.44943542,  11.07774281,
        -1.36484196,  46.27491016,  11.75272127,  31.86936077,
        37.50262643, -12.96696298,  57.84506126,  69.08963572,
       -11.01156093,  -4.98246628,  -2.70502784, -19.59879822,
        67.11843829,  12.43076254,  -2.18990868,  -5.76053432,
        30.75636258,   2.32066105, -27.34262945,  23.86179321,
         6.83557926,  38.6771704 ,   5.4039176 , -19.74764152,
        -1.87067716,  36.43479928,  -6.51198102,   1.46725762,
        54.16904585,  10.90929559,  63.31117438,  11.46281534,
        30.56631811,  19.12706775,  44.89570016,  -2.61577375,
         2.26721515,  30.26308875,  58.11514791,   5.97828353,
       -11.03024255,  -2.95225412,  49.22757724,  12.35191354,
        60.96914324,   7.13226438, -12.56451221,  66.19490992,
       -17.87080904,  27.71120954,   1.35281436,  35.80188293,
       -16.9561018 , -15.39986594,   0.58514808,  32.63009318,
        12.20705734,  -4.23991439,  66.45667292,  67.1467423 ,
        32.08794442,  71.41162079,  -6.69518428,  -6.21886221,
         0.12338652, -17.3127624 ,   5.34228616,  -5.28529409,
        12.78867194,  -0.79418746,   9.26418582,  -5.09157918,
        46.85243872,   8.764054  ,   3.67975868, -14.2596615 ,
        10.76950969,  40.52879738,  66.68991439,  23.82932953,
         3.60368565,  42.69170346,   8.47585468,  64.57462177,
        -7.65456788,  -6.94218944,  53.62941074,  -9.46495613,
        33.06521281,  53.70369254,  21.28483189,  35.32587129,
         8.0646854 ,  69.71120081,  48.09456914,  66.440138  ,
       -11.75407332,  29.66519856,  20.11456971, -15.5240168 ,
        -5.4359874 , -14.34577371,  -0.26161014,  -4.41381492,
       -16.60818486, -17.69304935,  -7.09102285,  -6.55568194,
       -11.53152147,  59.64454771,  15.40693518,  68.11999211,
        36.45709991,  -6.1543164 , -16.20525925, -11.24193557,
        18.08161099,  40.05749666,  35.53561637,  47.87203529,
        -4.38230475,   7.44872708,   7.24849564,   7.74243436,
        43.23607339,  -7.2239746 , -12.54961912,  11.10762799,
        51.24267263,  -3.18134816,  -5.56914843,  66.37558673,
        34.01434221])
golden_data_output = golden_data.copy()
golden_data_output["Predictions"] = predictions
golden_data_output.to_csv("../../Output Files/Data/prediction.csv")
Analyze Predictions with SHAP values:
shap.initjs()
explainer = shap.TreeExplainer(complex_model)
shap_values = explainer.shap_values(golden_data, predictions, check_additivity=False)
shap.summary_plot(shap_values, golden_data, max_display=len(golden_data.index))
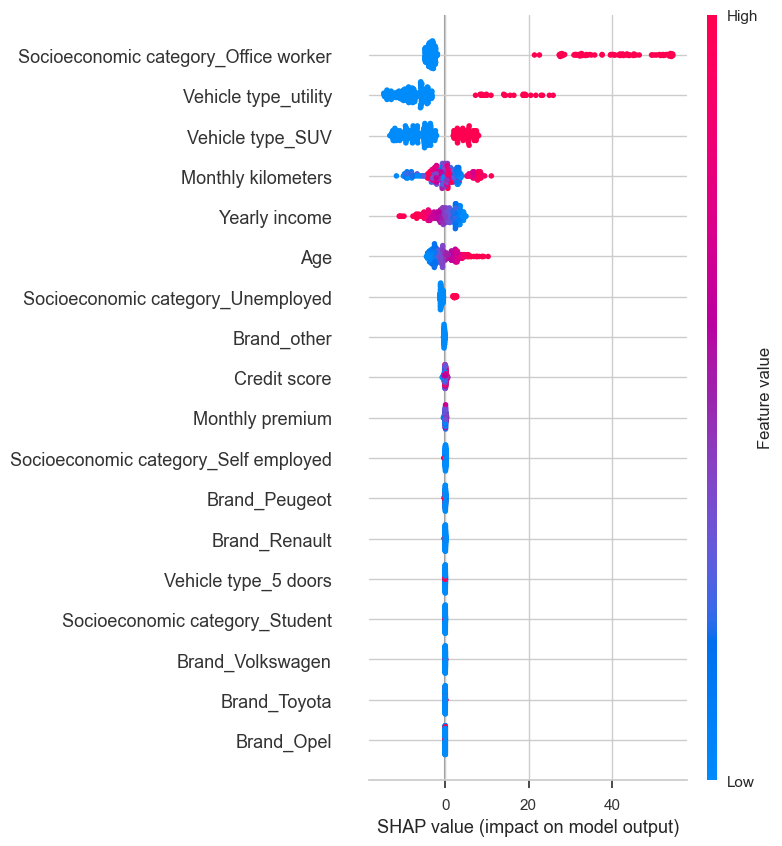
Observations:
- Vehicle type 5 doors and SUV to blame for low Net-profit forecasting.
- Numerical variables Age and monthly kilometers and CRM score contributed the most for higher net profit.
- Other features such as Brands, Socioeconomic status has no effect compared to variables on the top.
- From feature importance plot it shows Yearly income, monthly kilometers, Age and CRM score are the most important factors in deciding net profit.
- It would be insightful to understand what to blame for high or low net profit from an out-of-sample dataset, as per individual forecasts.
- Higher age and monthly kilometers contributes higher net-profit, tho there are some cases where high value of age “red” decreases nonprofit, a dependence plot between two features will show how two similar values of monthly kilometers contributes differently to profit as it depends on interaction of two features.
Individual Explanations of High and Low net profit forecasts.
shap.plots._waterfall.waterfall_legacy(explainer.expected_value,
                                       shap_values[1],
                                       golden_data.iloc[1],
                                       golden_data.columns)
print(predictions[1])
golden_data.iloc[1]
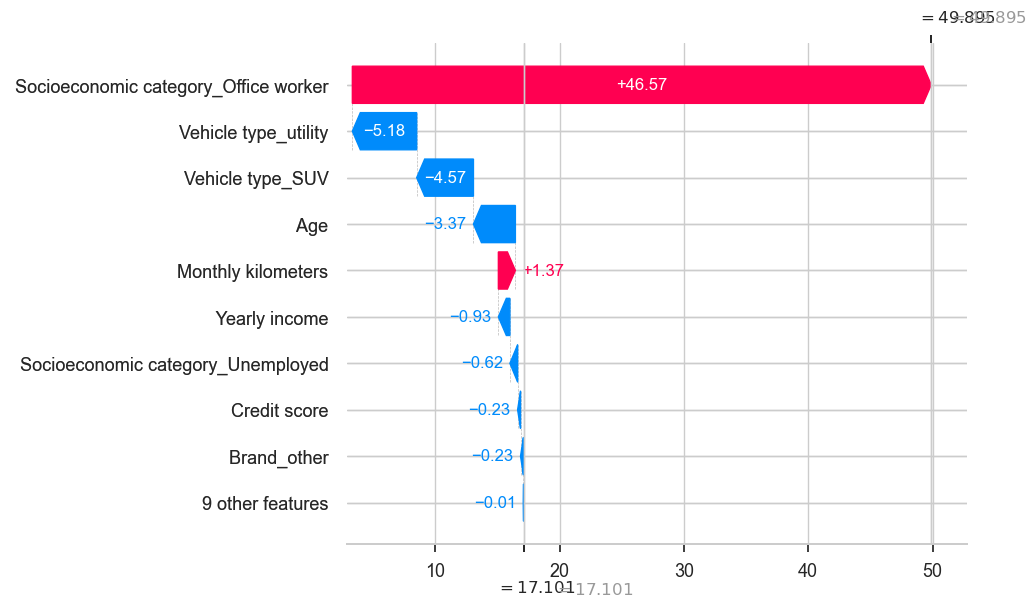
Predicted-Profit             49.894912616226186
Age                                        21.0
Monthly premium                            14.0
Monthly kilometers                        694.0
Yearly income                           34900.0
Credit score                              833.0
Brand_Opel                                  1.0
Brand_Peugeot                               0.0
Brand_Renault                               0.0
Brand_Toyota                                0.0
Brand_Volkswagen                            0.0
Vehicle type_5 doors                        1.0
Vehicle type_SUV                            0.0
Vehicle type_utility                        0.0
Socioeconomic category_Office worker        1.0
Socioeconomic category_Self employed        0.0
Socioeconomic category_Student              0.0
Socioeconomic category_Unemployed           0.0
Brand_other                                 0.0
Name: 1001, dtype: float64
shap.plots._waterfall.waterfall_legacy(explainer.expected_value,
                                       shap_values[292],
                                       golden_data.iloc[292],
                                       golden_data.columns)
print(predictions[292])
golden_data.iloc[292]
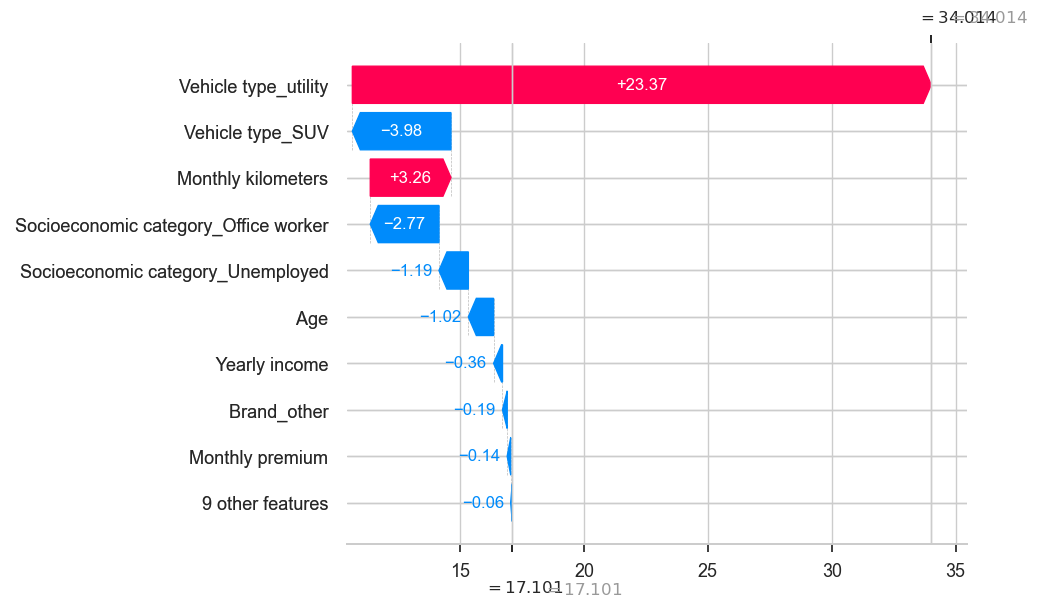
Predicted-Profit               34.0143422063608
Age                                        33.0
Monthly premium                             8.0
Monthly kilometers                        748.0
Yearly income                           32360.0
Credit score                              271.0
Brand_Opel                                  1.0
Brand_Peugeot                               0.0
Brand_Renault                               0.0
Brand_Toyota                                0.0
Brand_Volkswagen                            0.0
Vehicle type_5 doors                        0.0
Vehicle type_SUV                            0.0
Vehicle type_utility                        1.0
Socioeconomic category_Office worker        0.0
Socioeconomic category_Self employed        0.0
Socioeconomic category_Student              1.0
Socioeconomic category_Unemployed           0.0
Brand_other                                 0.0
Name: 1298, dtype: float64
shap.plots._waterfall.waterfall_legacy(explainer.expected_value,
                                       shap_values[185],
                                       golden_data.iloc[185],
                                       golden_data.columns)
print(predictions[185])
golden_data.iloc[185]
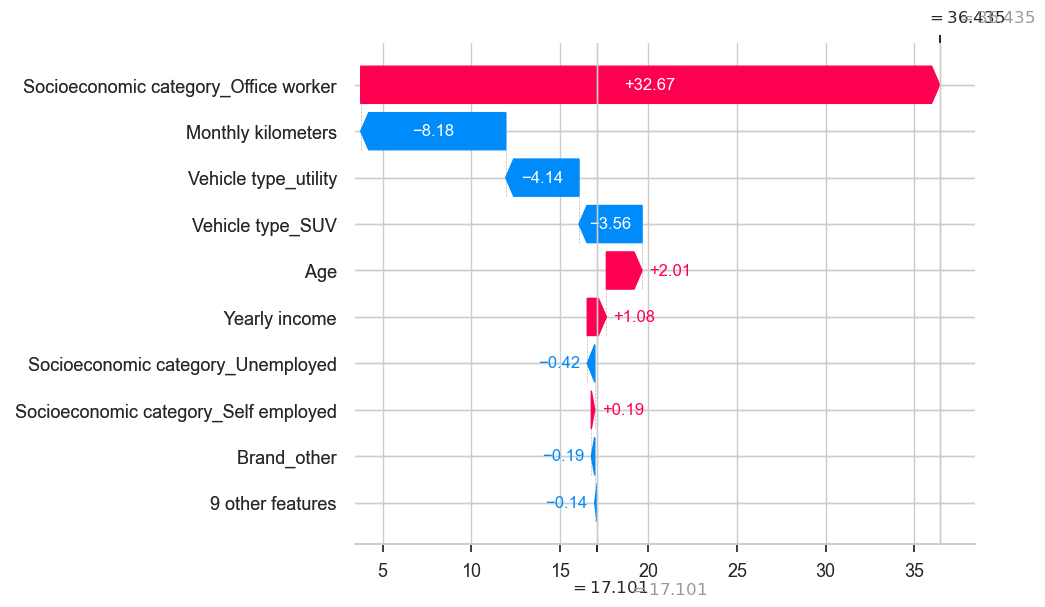
Predicted-Profit             36.434799275715484
Age                                        42.0
Monthly premium                            15.0
Monthly kilometers                        345.0
Yearly income                           21730.0
Credit score                               78.0
Brand_Opel                                  0.0
Brand_Peugeot                               0.0
Brand_Renault                               0.0
Brand_Toyota                                0.0
Brand_Volkswagen                            0.0
Vehicle type_5 doors                        0.0
Vehicle type_SUV                            0.0
Vehicle type_utility                        0.0
Socioeconomic category_Office worker        1.0
Socioeconomic category_Self employed        0.0
Socioeconomic category_Student              0.0
Socioeconomic category_Unemployed           0.0
Brand_other                                 0.0
Name: 1190, dtype: float64
shap.plots._waterfall.waterfall_legacy(explainer.expected_value,
                                       shap_values[3],
                                       golden_data.iloc[3],
                                       golden_data.columns)
print(predictions[3])
golden_data.iloc[3]
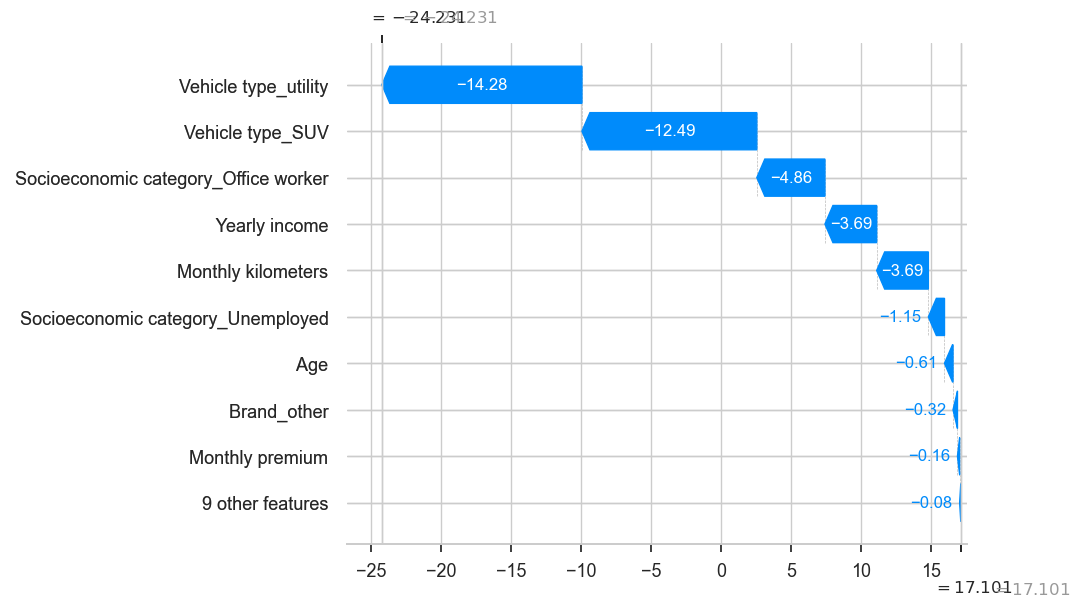
Predicted-Profit             -24.23093475368557
Age                                        33.0
Monthly premium                             2.0
Monthly kilometers                        970.0
Yearly income                           45450.0
Credit score                              990.0
Brand_Opel                                  0.0
Brand_Peugeot                               0.0
Brand_Renault                               0.0
Brand_Toyota                                0.0
Brand_Volkswagen                            0.0
Vehicle type_5 doors                        1.0
Vehicle type_SUV                            0.0
Vehicle type_utility                        0.0
Socioeconomic category_Office worker        0.0
Socioeconomic category_Self employed        0.0
Socioeconomic category_Student              1.0
Socioeconomic category_Unemployed           0.0
Brand_other                                 0.0
Name: 1003, dtype: float64
shap.plots._waterfall.waterfall_legacy(explainer.expected_value,
                                       shap_values[19],
                                       golden_data.iloc[19],
                                       golden_data.columns)
print(predictions[19])
golden_data.iloc[19]
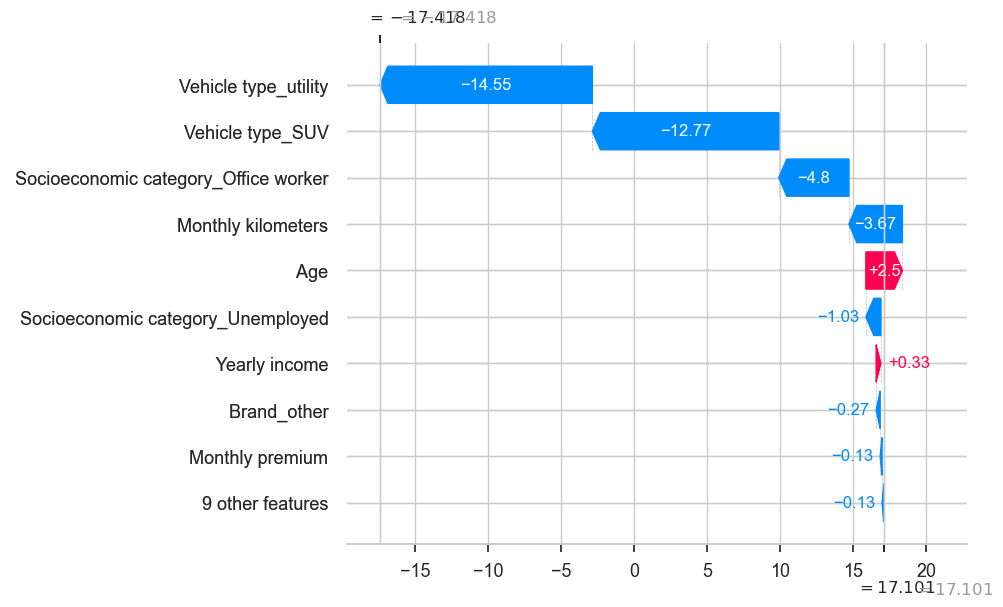
Predicted-Profit             -17.41840315625436
Age                                        45.0
Monthly premium                             4.0
Monthly kilometers                        993.0
Yearly income                           29160.0
Credit score                              255.0
Brand_Opel                                  0.0
Brand_Peugeot                               0.0
Brand_Renault                               1.0
Brand_Toyota                                0.0
Brand_Volkswagen                            0.0
Vehicle type_5 doors                        0.0
Vehicle type_SUV                            0.0
Vehicle type_utility                        0.0
Socioeconomic category_Office worker        0.0
Socioeconomic category_Self employed        0.0
Socioeconomic category_Student              0.0
Socioeconomic category_Unemployed           0.0
Brand_other                                 0.0
Name: 1021, dtype: float64
shap.plots._waterfall.waterfall_legacy(explainer.expected_value,
                                       shap_values[140],
                                       golden_data.iloc[140],
                                       golden_data.columns)
print(predictions[140])
golden_data.iloc[140]
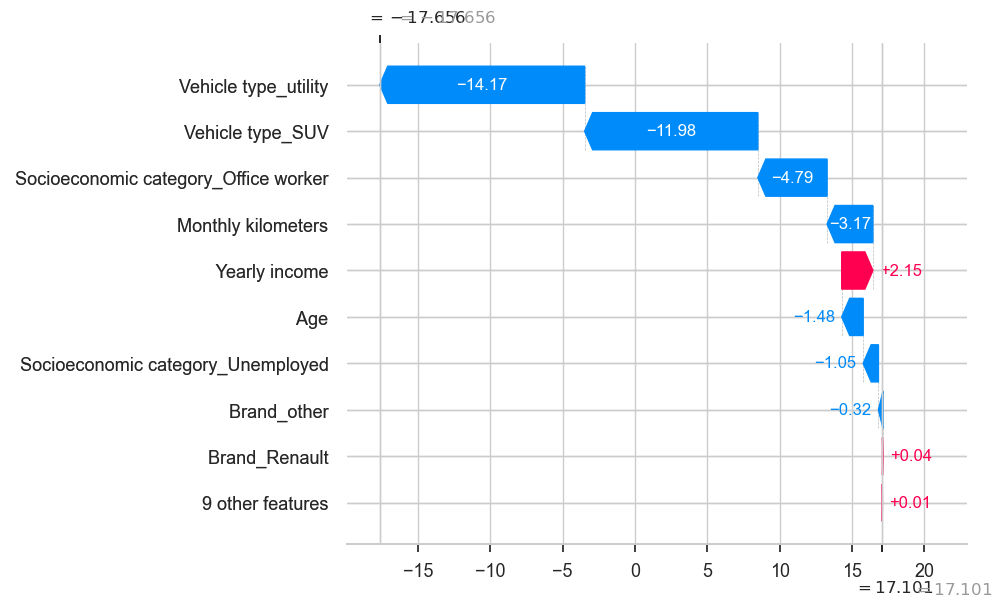
Predicted-Profit             -17.65590834806663
Age                                        30.0
Monthly premium                            27.0
Monthly kilometers                        915.0
Yearly income                           19460.0
Credit score                              746.0
Brand_Opel                                  0.0
Brand_Peugeot                               1.0
Brand_Renault                               0.0
Brand_Toyota                                0.0
Brand_Volkswagen                            0.0
Vehicle type_5 doors                        0.0
Vehicle type_SUV                            0.0
Vehicle type_utility                        0.0
Socioeconomic category_Office worker        0.0
Socioeconomic category_Self employed        0.0
Socioeconomic category_Student              0.0
Socioeconomic category_Unemployed           0.0
Brand_other                                 0.0
Name: 1145, dtype: float64
shap.plots._waterfall.waterfall_legacy(explainer.expected_value,
                                       shap_values[264],
                                       golden_data.iloc[264],
                                       golden_data.columns)
print(predictions[264])
golden_data.iloc[264]
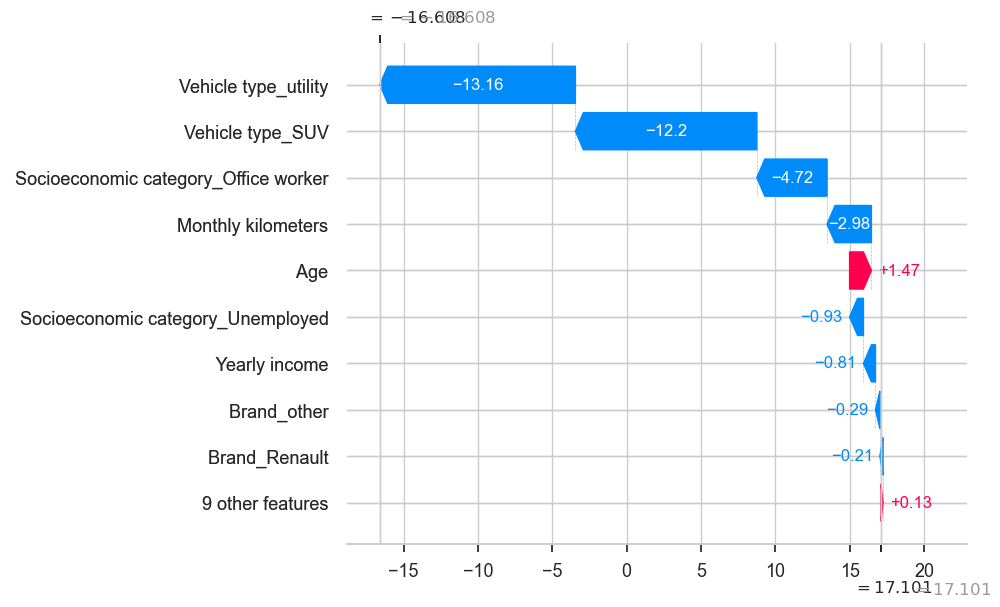
Predicted-Profit             -16.60818486301198
Age                                        41.0
Monthly premium                             5.0
Monthly kilometers                        801.0
Yearly income                           32950.0
Credit score                              824.0
Brand_Opel                                  0.0
Brand_Peugeot                               0.0
Brand_Renault                               1.0
Brand_Toyota                                0.0
Brand_Volkswagen                            0.0
Vehicle type_5 doors                        0.0
Vehicle type_SUV                            0.0
Vehicle type_utility                        0.0
Socioeconomic category_Office worker        0.0
Socioeconomic category_Self employed        0.0
Socioeconomic category_Student              0.0
Socioeconomic category_Unemployed           0.0
Brand_other                                 0.0
Name: 1270, dtype: float64