Churn Forecasting Series: Large Scale End-to-End Churn Modeling
import pandas as pd
import seaborn as sns
import matplotlib.pyplot as plt
import warnings
import numpy as np
from scipy.io import arff

# Disable warnings
warnings.filterwarnings('ignore')
data, meta = arff.loadarff('large_churn_data')
data = pd.DataFrame(data)
data.iloc[:, :8]
| year | month | user_account_id | user_lifetime | user_intake | user_no_outgoing_activity_in_days | user_account_balance_last | user_spendings | |
|---|---|---|---|---|---|---|---|---|
| 0 | 2013.0 | 6.0 | 13.0 | 1000.0 | 0.0 | 1.0 | 0.05 | 0.00 |
| 1 | 2013.0 | 6.0 | 14.0 | 1000.0 | 0.0 | 25.0 | 28.31 | 3.45 |
| 2 | 2013.0 | 6.0 | 18.0 | 1005.0 | 0.0 | 8.0 | 15.62 | 1.97 |
| 3 | 2013.0 | 6.0 | 27.0 | 1013.0 | 0.0 | 11.0 | 5.62 | 0.00 |
| 4 | 2013.0 | 6.0 | 32.0 | 1032.0 | 0.0 | 2.0 | 5.86 | 0.15 |
| ... | ... | ... | ... | ... | ... | ... | ... | ... |
| 66464 | 2013.0 | 8.0 | 1196937.0 | 15947.0 | 0.0 | 1.0 | 0.00 | 0.00 |
| 66465 | 2013.0 | 8.0 | 1196938.0 | 15947.0 | 0.0 | 1.0 | 0.00 | 0.00 |
| 66466 | 2013.0 | 8.0 | 1196939.0 | 15947.0 | 0.0 | 1.0 | 15.00 | 0.00 |
| 66467 | 2013.0 | 8.0 | 1196940.0 | 15947.0 | 0.0 | 1.0 | 0.00 | 0.00 |
| 66468 | 2013.0 | 8.0 | 1196944.0 | 1.0 | 1.0 | 1.0 | 15.00 | 0.00 |
66469 rows × 8 columns
data["churn"].value_counts()
churn
0.0    52562
1.0    13907
Name: count, dtype: int64
len(data.index)
66469
data.info()
<class 'pandas.core.frame.DataFrame'>
RangeIndex: 66469 entries, 0 to 66468
Data columns (total 66 columns):
 #   Column                                      Non-Null Count  Dtype
---  ------                                      --------------  -----
 0   year                                        66469 non-null  float64
 1   month                                       66469 non-null  float64
 2   user_account_id                             66469 non-null  float64
 3   user_lifetime                               66469 non-null  float64
 4   user_intake                                 66469 non-null  float64
 5   user_no_outgoing_activity_in_days           66469 non-null  float64
 6   user_account_balance_last                   66469 non-null  float64
 7   user_spendings                              66469 non-null  float64
 8   user_has_outgoing_calls                     66469 non-null  float64
 9   user_has_outgoing_sms                       66469 non-null  float64
 10  user_use_gprs                               66469 non-null  float64
 11  user_does_reload                            66469 non-null  float64
 12  reloads_inactive_days                       66469 non-null  float64
 13  reloads_count                               66469 non-null  float64
 14  reloads_sum                                 66469 non-null  float64
 15  calls_outgoing_count                        66469 non-null  float64
 16  calls_outgoing_spendings                    66469 non-null  float64
 17  calls_outgoing_duration                     66469 non-null  float64
 18  calls_outgoing_spendings_max                66469 non-null  float64
 19  calls_outgoing_duration_max                 66469 non-null  float64
 20  calls_outgoing_inactive_days                66469 non-null  float64
 21  calls_outgoing_to_onnet_count               66469 non-null  float64
 22  calls_outgoing_to_onnet_spendings           66469 non-null  float64
 23  calls_outgoing_to_onnet_duration            66469 non-null  float64
 24  calls_outgoing_to_onnet_inactive_days       66469 non-null  float64
 25  calls_outgoing_to_offnet_count              66469 non-null  float64
 26  calls_outgoing_to_offnet_spendings          66469 non-null  float64
 27  calls_outgoing_to_offnet_duration           66469 non-null  float64
 28  calls_outgoing_to_offnet_inactive_days      66469 non-null  float64
 29  calls_outgoing_to_abroad_count              66469 non-null  float64
 30  calls_outgoing_to_abroad_spendings          66469 non-null  float64
 31  calls_outgoing_to_abroad_duration           66469 non-null  float64
 32  calls_outgoing_to_abroad_inactive_days      66469 non-null  float64
 33  sms_outgoing_count                          66469 non-null  float64
 34  sms_outgoing_spendings                      66469 non-null  float64
 35  sms_outgoing_spendings_max                  66469 non-null  float64
 36  sms_outgoing_inactive_days                  66469 non-null  float64
 37  sms_outgoing_to_onnet_count                 66469 non-null  float64
 38  sms_outgoing_to_onnet_spendings             66469 non-null  float64
 39  sms_outgoing_to_onnet_inactive_days         66469 non-null  float64
 40  sms_outgoing_to_offnet_count                66469 non-null  float64
 41  sms_outgoing_to_offnet_spendings            66469 non-null  float64
 42  sms_outgoing_to_offnet_inactive_days        66469 non-null  float64
 43  sms_outgoing_to_abroad_count                66469 non-null  float64
 44  sms_outgoing_to_abroad_spendings            66469 non-null  float64
 45  sms_outgoing_to_abroad_inactive_days        66469 non-null  float64
 46  sms_incoming_count                          66469 non-null  float64
 47  sms_incoming_spendings                      66469 non-null  float64
 48  sms_incoming_from_abroad_count              66469 non-null  float64
 49  sms_incoming_from_abroad_spendings          66469 non-null  float64
 50  gprs_session_count                          66469 non-null  float64
 51  gprs_usage                                  66469 non-null  float64
 52  gprs_spendings                              66469 non-null  float64
 53  gprs_inactive_days                          66469 non-null  float64
 54  last_100_reloads_count                      66469 non-null  float64
 55  last_100_reloads_sum                        66469 non-null  float64
 56  last_100_calls_outgoing_duration            66469 non-null  float64
 57  last_100_calls_outgoing_to_onnet_duration   66469 non-null  float64
 58  last_100_calls_outgoing_to_offnet_duration  66469 non-null  float64
 59  last_100_calls_outgoing_to_abroad_duration  66469 non-null  float64
 60  last_100_sms_outgoing_count                 66469 non-null  float64
 61  last_100_sms_outgoing_to_onnet_count        66469 non-null  float64
 62  last_100_sms_outgoing_to_offnet_count       66469 non-null  float64
 63  last_100_sms_outgoing_to_abroad_count       66469 non-null  float64
 64  last_100_gprs_usage                         66469 non-null  float64
 65  churn                                       66469 non-null  float64
dtypes: float64(66)
memory usage: 33.5 MB
data.isnull().sum()
year                                     0
month                                    0
user_account_id                          0
user_lifetime                            0
user_intake                              0
                                        ..
last_100_sms_outgoing_to_onnet_count     0
last_100_sms_outgoing_to_offnet_count    0
last_100_sms_outgoing_to_abroad_count    0
last_100_gprs_usage                      0
churn                                    0
Length: 66, dtype: int64
data["churn"].value_counts()
churn
0.0    52562
1.0    13907
Name: count, dtype: int64
data.dtypes
year                                     float64
month                                    float64
user_account_id                          float64
user_lifetime                            float64
user_intake                              float64
                                          ...
last_100_sms_outgoing_to_onnet_count     float64
last_100_sms_outgoing_to_offnet_count    float64
last_100_sms_outgoing_to_abroad_count    float64
last_100_gprs_usage                      float64
churn                                    float64
Length: 66, dtype: object
data.columns
Index(['year', 'month', 'user_account_id', 'user_lifetime', 'user_intake',
       'user_no_outgoing_activity_in_days', 'user_account_balance_last',
       'user_spendings', 'user_has_outgoing_calls', 'user_has_outgoing_sms',
       'user_use_gprs', 'user_does_reload', 'reloads_inactive_days',
       'reloads_count', 'reloads_sum', 'calls_outgoing_count',
       'calls_outgoing_spendings', 'calls_outgoing_duration',
       'calls_outgoing_spendings_max', 'calls_outgoing_duration_max',
       'calls_outgoing_inactive_days', 'calls_outgoing_to_onnet_count',
       'calls_outgoing_to_onnet_spendings', 'calls_outgoing_to_onnet_duration',
       'calls_outgoing_to_onnet_inactive_days',
       'calls_outgoing_to_offnet_count', 'calls_outgoing_to_offnet_spendings',
       'calls_outgoing_to_offnet_duration',
       'calls_outgoing_to_offnet_inactive_days',
       'calls_outgoing_to_abroad_count', 'calls_outgoing_to_abroad_spendings',
       'calls_outgoing_to_abroad_duration',
       'calls_outgoing_to_abroad_inactive_days', 'sms_outgoing_count',
       'sms_outgoing_spendings', 'sms_outgoing_spendings_max',
       'sms_outgoing_inactive_days', 'sms_outgoing_to_onnet_count',
       'sms_outgoing_to_onnet_spendings',
       'sms_outgoing_to_onnet_inactive_days', 'sms_outgoing_to_offnet_count',
       'sms_outgoing_to_offnet_spendings',
       'sms_outgoing_to_offnet_inactive_days', 'sms_outgoing_to_abroad_count',
       'sms_outgoing_to_abroad_spendings',
       'sms_outgoing_to_abroad_inactive_days', 'sms_incoming_count',
       'sms_incoming_spendings', 'sms_incoming_from_abroad_count',
       'sms_incoming_from_abroad_spendings', 'gprs_session_count',
       'gprs_usage', 'gprs_spendings', 'gprs_inactive_days',
       'last_100_reloads_count', 'last_100_reloads_sum',
       'last_100_calls_outgoing_duration',
       'last_100_calls_outgoing_to_onnet_duration',
       'last_100_calls_outgoing_to_offnet_duration',
       'last_100_calls_outgoing_to_abroad_duration',
       'last_100_sms_outgoing_count', 'last_100_sms_outgoing_to_onnet_count',
       'last_100_sms_outgoing_to_offnet_count',
       'last_100_sms_outgoing_to_abroad_count', 'last_100_gprs_usage',
       'churn'],
      dtype='object')
data.drop("user_account_id", inplace=True,axis=1)
data["churn"] = data["churn"].astype(int)
data["churn_string"] = data["churn"].map({1:"churn",0:"active"})
EDA:
columns_to_visualize = data.columns.tolist()
columns_to_visualize.remove("churn")
columns_to_visualize.remove("churn_string")


# Calculate the number of rows and columns for the subplot grid
num_columns = len(columns_to_visualize)
num_rows = (num_columns + 4) // 5  # Adjust 5 to change columns per row

plt.figure(figsize=(20, num_rows * 3))  # Adjust the figure size as needed

for i, column in enumerate(columns_to_visualize):
    plt.subplot(num_rows, 5, i+1)  # Dynamically set rows and columns
    sns.histplot(data, x=column, hue="churn_string", element="poly")
    plt.title(column)
    plt.tight_layout()

plt.show()

zeros_count = {col: (data[col] == 0).sum() for col in data.select_dtypes(include=['float64'])}
zeros_df = pd.DataFrame(list(zeros_count.items()), columns=['Column', 'Number of Zeros'])
plt.figure(figsize=(7, 13))  # Adjust the figure size as needed

sns.barplot(y='Column', x='Number of Zeros', data=zeros_df)
plt.title('Zeros Count')
plt.show()

counts = []
for col in data.select_dtypes(include=['float64']):
    counts.append({'Column': col, 'Count': (data[col] == 0).sum(), 'Type': 'Zeros'})
    counts.append({'Column': col, 'Count': (data[col] != 0).sum(), 'Type': 'Non-Zeros'})

plt.figure(figsize=(7, 13))
count_df = pd.DataFrame(counts)
sns.barplot(y='Column', x='Count', hue='Type', data=count_df)
plt.title('Zeros and Non-Zeros Columns')
plt.show()

churn_counts = data['churn'].value_counts()
plt.pie(churn_counts, labels=churn_counts.index, autopct='%1.1f%%', startangle=140, colors=['skyblue', 'salmon'])
plt.title('Churn Distribution')
plt.show()

corr = data.drop("churn_string",axis=1).corr()

# Creating a heatmap
plt.figure(figsize=(15, 15))
sns.heatmap(corr, annot=False,fmt='.2f',cmap="rocket")
plt.title('Correlation Heatmap')
plt.show()

spearman_corr = data.drop("churn_string",axis=1).corr(method='spearman')

plt.figure(figsize=(15, 15))
sns.heatmap(spearman_corr, annot=False,cmap="rocket",fmt='.2f')
plt.title('Pearson Correlation Heatmap')
plt.show()

data["churn_string"] = data["churn"].map({0: "active", 1: "churn"})

numerical_columns = data.columns.tolist()
numerical_columns.remove("churn")
numerical_columns.remove("churn_string")

num_columns = len(numerical_columns)
num_rows = (num_columns + 5) // 6  # 6 plots per row


fig, axs = plt.subplots(num_rows, 6, figsize=(20, 4*num_rows))  # Adjust figsize as needed


axs = axs.flatten()


for i, column in enumerate(numerical_columns):
    data.pivot(columns='churn_string', values=column).plot.hist(bins=40, ax=axs[i], title=column)
    axs[i].set_title(column)  # Set the title for each subplot


for i in range(len(numerical_columns), len(axs)):
    axs[i].set_visible(False)

plt.tight_layout()
plt.show()

data.drop("churn_string", axis=1, inplace=True)

Modeling:
Split the data:
data["churn"].value_counts()
churn
0    52562
1    13907
Name: count, dtype: int64
from sklearn import  model_selection

X_train, X_test, y_train, y_test= model_selection.train_test_split(
    data.drop(columns=['churn'],axis=1), data.churn, stratify=data.churn, random_state=42)

X_train.shape, X_test.shape, y_train.shape, y_test.shape
((49851, 64), (16618, 64), (49851,), (16618,))
y_train.value_counts()
churn
0    39421
1    10430
Name: count, dtype: int64
y_test.value_counts()
churn
0    13141
1     3477
Name: count, dtype: int64
Initial Models:
import xgboost as xgb
xg = xgb.XGBClassifier()
xg.fit(X_train, y_train)
xg.score(X_test, y_test)
0.8762185581899146
from sklearn import linear_model, preprocessing
std = preprocessing.StandardScaler()
lr = linear_model.LogisticRegression(penalty=None)
lr.fit(std.fit_transform(X_train), y_train)
lr.score(std.transform(X_test), y_test)
0.8656878084005295
from sklearn import dummy

dum = dummy.DummyClassifier()
dum.fit(X_train, y_train)
dum.score(X_test, y_test)
0.7907690456131905
import xgboost as xgb
xg = xgb.XGBClassifier(early_stopping_rounds=30)
xg.fit(X_train, y_train, eval_set=[(X_train, y_train),
                                   (X_test, y_test)],
       verbose=10)
xg.score(X_test, y_test)
[0]	validation_0-logloss:0.40680	validation_1-logloss:0.40818
[10]	validation_0-logloss:0.27387	validation_1-logloss:0.29215
[20]	validation_0-logloss:0.26279	validation_1-logloss:0.29272
[30]	validation_0-logloss:0.25650	validation_1-logloss:0.29388
[40]	validation_0-logloss:0.24975	validation_1-logloss:0.29504
[42]	validation_0-logloss:0.24930	validation_1-logloss:0.29527


0.876940666746901
xg.best_iteration
12
results = xg.evals_result()

ax = (pd.DataFrame({'training': results['validation_0']['logloss'],
                    'testing': results['validation_1']['logloss']})
      .assign(ntrees=lambda adf: range(1, len(adf)+1))
      .set_index('ntrees')
      .plot(figsize=(5,4),
            title='eval_results with early_stopping')
      )
ax.annotate('Best number \nof trees (10)', xy=(20, .18),
            xytext=(34,.32), arrowprops={'color':'k'})
ax.set_xlabel('ntrees')
Text(0.5, 0, 'ntrees')

from sklearn.model_selection import StratifiedKFold
from yellowbrick.model_selection import LearningCurve

cv = StratifiedKFold(n_splits=50)

model = xgb.XGBClassifier()
visualizer = LearningCurve(
    xgb.XGBClassifier(), cv=cv, scoring='f1', n_jobs=4
)

visualizer.fit(X_train, y_train)
visualizer.show()

<Axes: title={'center': 'Learning Curve for XGBClassifier'}, xlabel='Training Instances', ylabel='Score'>
Evaluation
from sklearn import metrics
cm = metrics.confusion_matrix(y_test, xg.predict(X_test))
cm
array([[12251,   890],
       [ 1155,  2322]])
disp = metrics.ConfusionMatrixDisplay(confusion_matrix=cm,
                                      display_labels=['Active', 'Churn'])
disp.plot(cmap='Blues')
<sklearn.metrics._plot.confusion_matrix.ConfusionMatrixDisplay at 0x2a2476210>

# cmap on raw counts many be confusing
cm = metrics.confusion_matrix(y_test, xg.predict(X_test),
                              normalize='true')
disp = metrics.ConfusionMatrixDisplay(confusion_matrix=cm,
                                      display_labels=['Active', 'Churn'])
disp.plot(cmap='Blues')
<sklearn.metrics._plot.confusion_matrix.ConfusionMatrixDisplay at 0x2a242d7d0>

from sklearn import metrics

print(metrics.classification_report(y_test, xg.predict(X_test),
                                    target_names=['Active', 'Churn']))
              precision    recall  f1-score   support

      Active       0.91      0.93      0.92     13141
       Churn       0.72      0.67      0.69      3477

    accuracy                           0.88     16618
   macro avg       0.82      0.80      0.81     16618
weighted avg       0.87      0.88      0.88     16618
print(metrics.classification_report(y_test, lr.predict(X_test),
                                    target_names=['N', 'Y']))
              precision    recall  f1-score   support

           N       0.95      0.47      0.63     13141
           Y       0.31      0.90      0.46      3477

    accuracy                           0.56     16618
   macro avg       0.63      0.69      0.55     16618
weighted avg       0.81      0.56      0.60     16618
from yellowbrick import classifier
import matplotlib.pyplot as plt
fig, ax = plt.subplots(figsize=(8,4))
classifier.precision_recall_curve(xg, X_train, y_train,
                                  X_test, y_test, ax=ax, per_class=True)
ax.set_ylim((0,1.05))

(0.0, 1.05)
from yellowbrick.classifier import DiscriminationThreshold

model = xgb.XGBClassifier()
visualizer = DiscriminationThreshold(model)

visualizer.fit(X_train, y_train)
visualizer.show()

<Axes: title={'center': 'Threshold Plot for XGBClassifier'}, xlabel='discrimination threshold', ylabel='score'>
from sklearn.metrics import make_scorer, f1_score, precision_score, recall_score, roc_auc_score, accuracy_score


def metric_data(clf, X, y, metrics=['accuracy'], cv=4):
    res = pd.DataFrame(model_selection.cross_validate(clf, X, y, cv=cv, scoring=metrics,
                                                      return_train_score=True, ))
    return res


sample_size = len(data)
small_data = data.sample(sample_size).drop(columns=['churn'])
small_y = data.loc[small_data.index].churn == 1
scorers = {
    'f1_score': make_scorer(f1_score, average='micro'),
    'precision_score': make_scorer(precision_score, average='micro'),
    'recall_score': make_scorer(recall_score, average='micro'),
    'accuracy_score': make_scorer(accuracy_score),
    'roc_auc_score': make_scorer(roc_auc_score),
}

xg_data = metric_data(xgb.XGBClassifier(), small_data, small_y, metrics=scorers)
xg_data.iloc[:, :9]
| fit_time | score_time | test_f1_score | train_f1_score | test_precision_score | train_precision_score | test_recall_score | train_recall_score | test_accuracy_score | |
|---|---|---|---|---|---|---|---|---|---|
| 0 | 0.493094 | 0.021333 | 0.877181 | 0.897194 | 0.877181 | 0.897194 | 0.877181 | 0.897194 | 0.877181 |
| 1 | 0.559788 | 0.021369 | 0.878257 | 0.897115 | 0.878257 | 0.897115 | 0.878257 | 0.897115 | 0.878257 |
| 2 | 0.539547 | 0.022056 | 0.871036 | 0.899984 | 0.871036 | 0.899984 | 0.871036 | 0.899984 | 0.871036 |
| 3 | 0.576529 | 0.021437 | 0.877535 | 0.899503 | 0.877535 | 0.899503 | 0.877535 | 0.899503 | 0.877535 |
(xg_data
 .assign(type='xg')
 .groupby('type')
 .mean()
 .plot.bar()
 .legend(bbox_to_anchor=(1,1))
 )
<matplotlib.legend.Legend at 0x2a26a7150>

Tuning
from hyperopt import fmin, tpe, hp, Trials
from hyperopt import fmin, tpe, hp, STATUS_OK, Trials
from sklearn.metrics import accuracy_score, roc_auc_score

from typing import Any, Dict, Union

def hyperparameter_tuning(space: Dict[str, Union[float, int]],
                          X_train: pd.DataFrame, y_train: pd.Series,
                          X_test: pd.DataFrame, y_test: pd.Series,
                          early_stopping_rounds: int=50,
                          metric:callable=accuracy_score) -> Dict[str, Any]:

    int_vals = ['max_depth', 'reg_alpha']
    space = {k: (int(val) if k in int_vals else val)
             for k,val in space.items()}
    space['early_stopping_rounds'] = early_stopping_rounds
    model = xgb.XGBClassifier(**space)
    evaluation = [(X_train, y_train),
                  (X_test, y_test)]
    model.fit(X_train, y_train,
              eval_set=evaluation,
              verbose=False)

    pred = model.predict(X_test)
    score = metric(y_test, pred)
    return {'loss': -score, 'status': STATUS_OK, 'model': model}

params = {'random_state': 42, 'eval_metric': 'aucpr'}

rounds = [{'max_depth': hp.quniform('max_depth', 1, 8, 1),  # tree
           'min_child_weight': hp.loguniform('min_child_weight', -2, 3)},
          {'scale_pos_weight':hp.uniform('scale_pos_weight', 0, 10), # imbalanced
           'max_delta_step':hp.uniform('max_delta_step', 0, 10)},
          {'subsample': hp.uniform('subsample', 0.5, 1),   # stochastic
           'colsample_bytree': hp.uniform('colsample_bytree', 0.5, 1)},
          {'reg_alpha': hp.uniform('reg_alpha', 0, 10),
           'reg_lambda': hp.uniform('reg_lambda', 1, 10),},
          {'gamma': hp.loguniform('gamma', -10, 10)}, # regularization
          {'learning_rate': hp.loguniform('learning_rate', -7, 0)} # boosting
          ]

all_trials = []
for round in rounds:
    params = {**params, **round}
    trials = Trials()
    best = fmin(fn=lambda space: hyperparameter_tuning(space, X_train,
                                                       y_train, X_test, y_test),
                space=params,
                algo=tpe.suggest,
                max_evals=20,
                trials=trials,
                )
    params = {**params, **best}
    all_trials.append(trials)
100%|██████████| 20/20 [00:17<00:00,  1.14trial/s, best loss: -0.8778433024431339]
100%|██████████| 20/20 [00:17<00:00,  1.13trial/s, best loss: -0.876940666746901]
100%|██████████| 20/20 [00:17<00:00,  1.14trial/s, best loss: -0.8773618967384763]
100%|██████████| 20/20 [00:22<00:00,  1.13s/trial, best loss: -0.8776627753038874]
100%|██████████| 20/20 [00:20<00:00,  1.03s/trial, best loss: -0.8776627753038874]
100%|██████████| 20/20 [00:24<00:00,  1.21s/trial, best loss: -0.8772415453123119]
params
{'random_state': 42,
 'eval_metric': 'aucpr',
 'max_depth': 6.0,
 'min_child_weight': 0.23193058123356144,
 'scale_pos_weight': 0.9019571775366886,
 'max_delta_step': 4.521025902082406,
 'subsample': 0.6927185598814062,
 'colsample_bytree': 0.9760587389780198,
 'reg_alpha': 9.42070439253806,
 'reg_lambda': 7.767016493057269,
 'gamma': 0.0026822919233543095,
 'learning_rate': 0.1369703361489519}
step_params = {'random_state': 42,
 'eval_metric': 'aucpr',
 'max_depth': 6,
 'min_child_weight': 0.23193058123356144,
 'scale_pos_weight': 0.9019571775366886,
 'max_delta_step': 4.521025902082406,
 'subsample': 0.6927185598814062,
 'colsample_bytree': 0.9760587389780198,
 'reg_alpha': 9.42070439253806,
 'reg_lambda': 7.767016493057269,
 'gamma': 0.0026822919233543095,
 'learning_rate': 0.1369703361489519}
import xgboost as xgb
xg_step = xgb.XGBClassifier(**step_params, early_stopping_rounds=100, n_estimators=250)
xg_step.fit(X_train, y_train, eval_set=[(X_train, y_train),
                                        (X_test, y_test)],
            verbose=100)
xg_step.score(X_test, y_test)
[0]	validation_0-aucpr:0.72961	validation_1-aucpr:0.71990
[100]	validation_0-aucpr:0.78069	validation_1-aucpr:0.76154
[200]	validation_0-aucpr:0.79322	validation_1-aucpr:0.76115
[230]	validation_0-aucpr:0.79634	validation_1-aucpr:0.76068


0.8768203153207366
xg_step.best_iteration
131
import xgboost as xgb
xg = xgb.XGBClassifier()
xg.fit(X_train, y_train)
xg.score(X_test, y_test)
0.8762185581899146
import matplotlib.pyplot as plt
from sklearn import metrics

fig, axes = plt.subplots(figsize=(8,4), ncols=2)
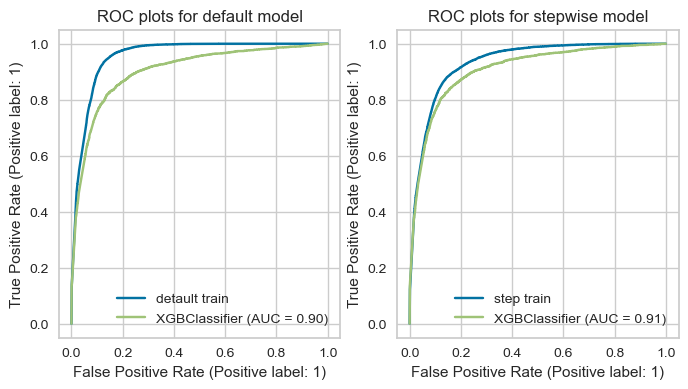
metrics.RocCurveDisplay.from_estimator(xg,
                                       X_train, y_train,ax=axes[0], label='detault train')
metrics.RocCurveDisplay.from_estimator(xg,
                                       X_test, y_test,ax=axes[0])#, label='default test')
axes[0].set(title='ROC plots for default model')

metrics.RocCurveDisplay.from_estimator(xg_step,
                                       X_train, y_train,ax=axes[1], label='step train')
metrics.RocCurveDisplay.from_estimator(xg_step,
                                       X_test, y_test,ax=axes[1])#, label='step test')
axes[1].set(title='ROC plots for stepwise model')
[Text(0.5, 1.0, 'ROC plots for stepwise model')]
from yellowbrick import classifier

fig, axes = plt.subplots(figsize=(8,4), ncols=2)
classifier.precision_recall_curve(xg, X_train, y_train,
                                  X_test, y_test, micro=False, macro=False, ax=axes[0], per_class=True,
                                  show=False)
axes[0].set_ylim((0,1.05))
axes[0].set(title='PR plots for default model')

classifier.precision_recall_curve(xg_step, X_train, y_train,
                                  X_test, y_test, micro=False, macro=False, ax=axes[1], per_class=True,
                                  show=False)
axes[1].set_ylim((0,1.05))
axes[1].set(title='PR plots for stepwise model')
[Text(0.5, 1.0, 'PR plots for stepwise model')]

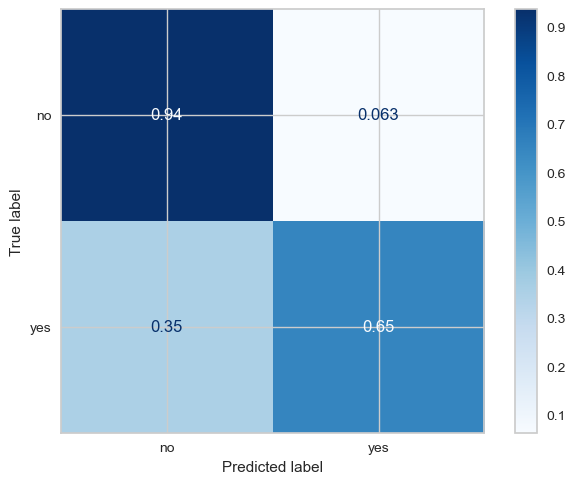
from sklearn import metrics

cm = metrics.confusion_matrix(y_test, xg_step.predict(X_test),
                              normalize='true')
disp = metrics.ConfusionMatrixDisplay(confusion_matrix=cm,
                                      display_labels=['no', 'yes'])
disp.plot(cmap='Blues')
<sklearn.metrics._plot.confusion_matrix.ConfusionMatrixDisplay at 0x2e01d6e10>
Interpreting
from sklearn import linear_model, preprocessing
std = preprocessing.StandardScaler()
lr = linear_model.LogisticRegression(penalty=None)
lr.fit(std.fit_transform(X_train), y_train)
lr.score(std.transform(X_test), y_test)
0.8656878084005295
feature_importances = pd.Series(xg_step.feature_importances_, index=X_train.columns).sort_values()
plt.figure(figsize=(8, 12))
feature_importances.plot.barh()
plt.show()

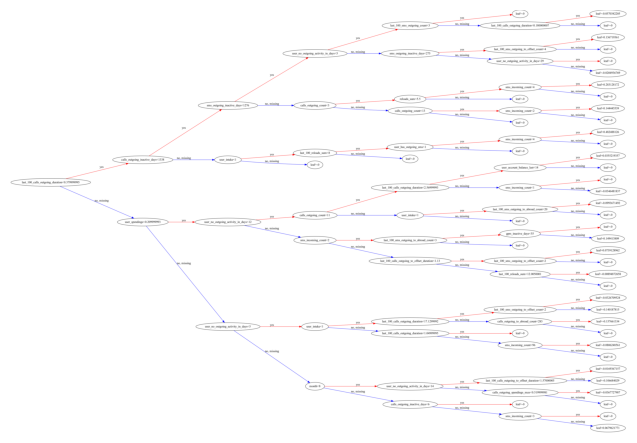
xgb.plot_tree(xg_step, num_trees=0, rankdir='LR')
<Axes: >
import dtreeviz

viz = dtreeviz.model(xg_step, X_train=X_train,
                     y_train=y_train,
                     target_name='Subscribed',
                     feature_names=list(X_train.columns), class_names=['Active', 'Churn'],
                     tree_index=0)
viz.view()
import xgboost as xgb
xg_step = xgb.XGBClassifier(**step_params, early_stopping_rounds=20)
xg_step.fit(X_train, y_train, eval_set=[(X_train, y_train),
                                        (X_test, y_test)],
            verbose=100)
xg_step.score(X_test, y_test)
[0]	validation_0-aucpr:0.72961	validation_1-aucpr:0.71990
[91]	validation_0-aucpr:0.77963	validation_1-aucpr:0.76151


0.8762185581899146
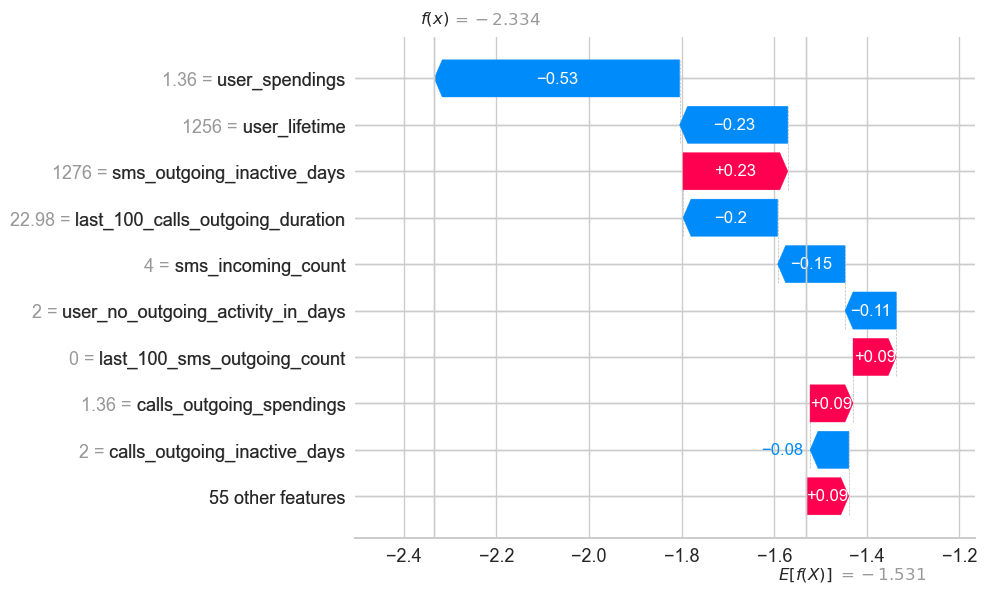
import shap
shap.initjs()

shap_ex = shap.TreeExplainer(xg_step)
vals = shap_ex(X_test)
vals_df = pd.DataFrame(vals.values, columns=X_test.columns, index=X_test.index)
shap_ex.expected_value
-1.5311589
# index 40153 prediction
(vals_df.sum(axis='columns') + shap_ex.expected_value).pipe(lambda ser: ser[ser > 0])
60710    0.450789
64399    1.400459
62002    1.400459
62986    1.400459
25853    0.352904
           ...
64617    0.785654
59634    0.494769
47023    1.122428
59216    0.078687
63871    1.400459
Length: 3072, dtype: float32
vals_df.loc[62986]
year                                     0.000000
month                                    0.120240
user_lifetime                            0.011200
user_intake                             -0.006299
user_no_outgoing_activity_in_days        0.106907
                                           ...
last_100_sms_outgoing_count              0.047387
last_100_sms_outgoing_to_onnet_count     0.004574
last_100_sms_outgoing_to_offnet_count    0.035136
last_100_sms_outgoing_to_abroad_count   -0.001823
last_100_gprs_usage                     -0.000812
Name: 62986, Length: 64, dtype: float32
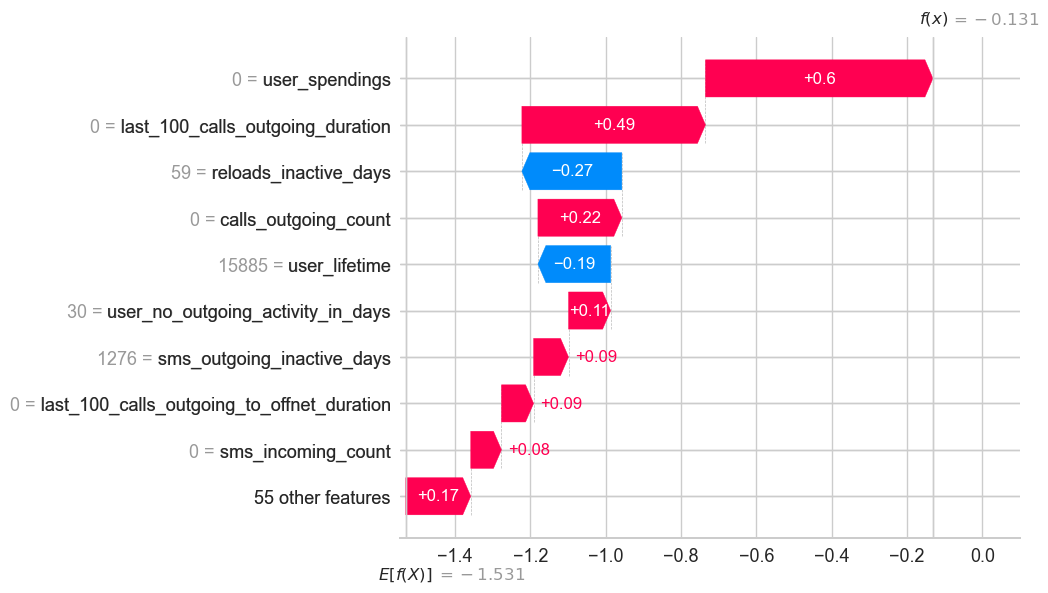
shap.plots.waterfall(vals[26])
shap.plots.waterfall(vals[28])

shap.plots.waterfall(vals[29])
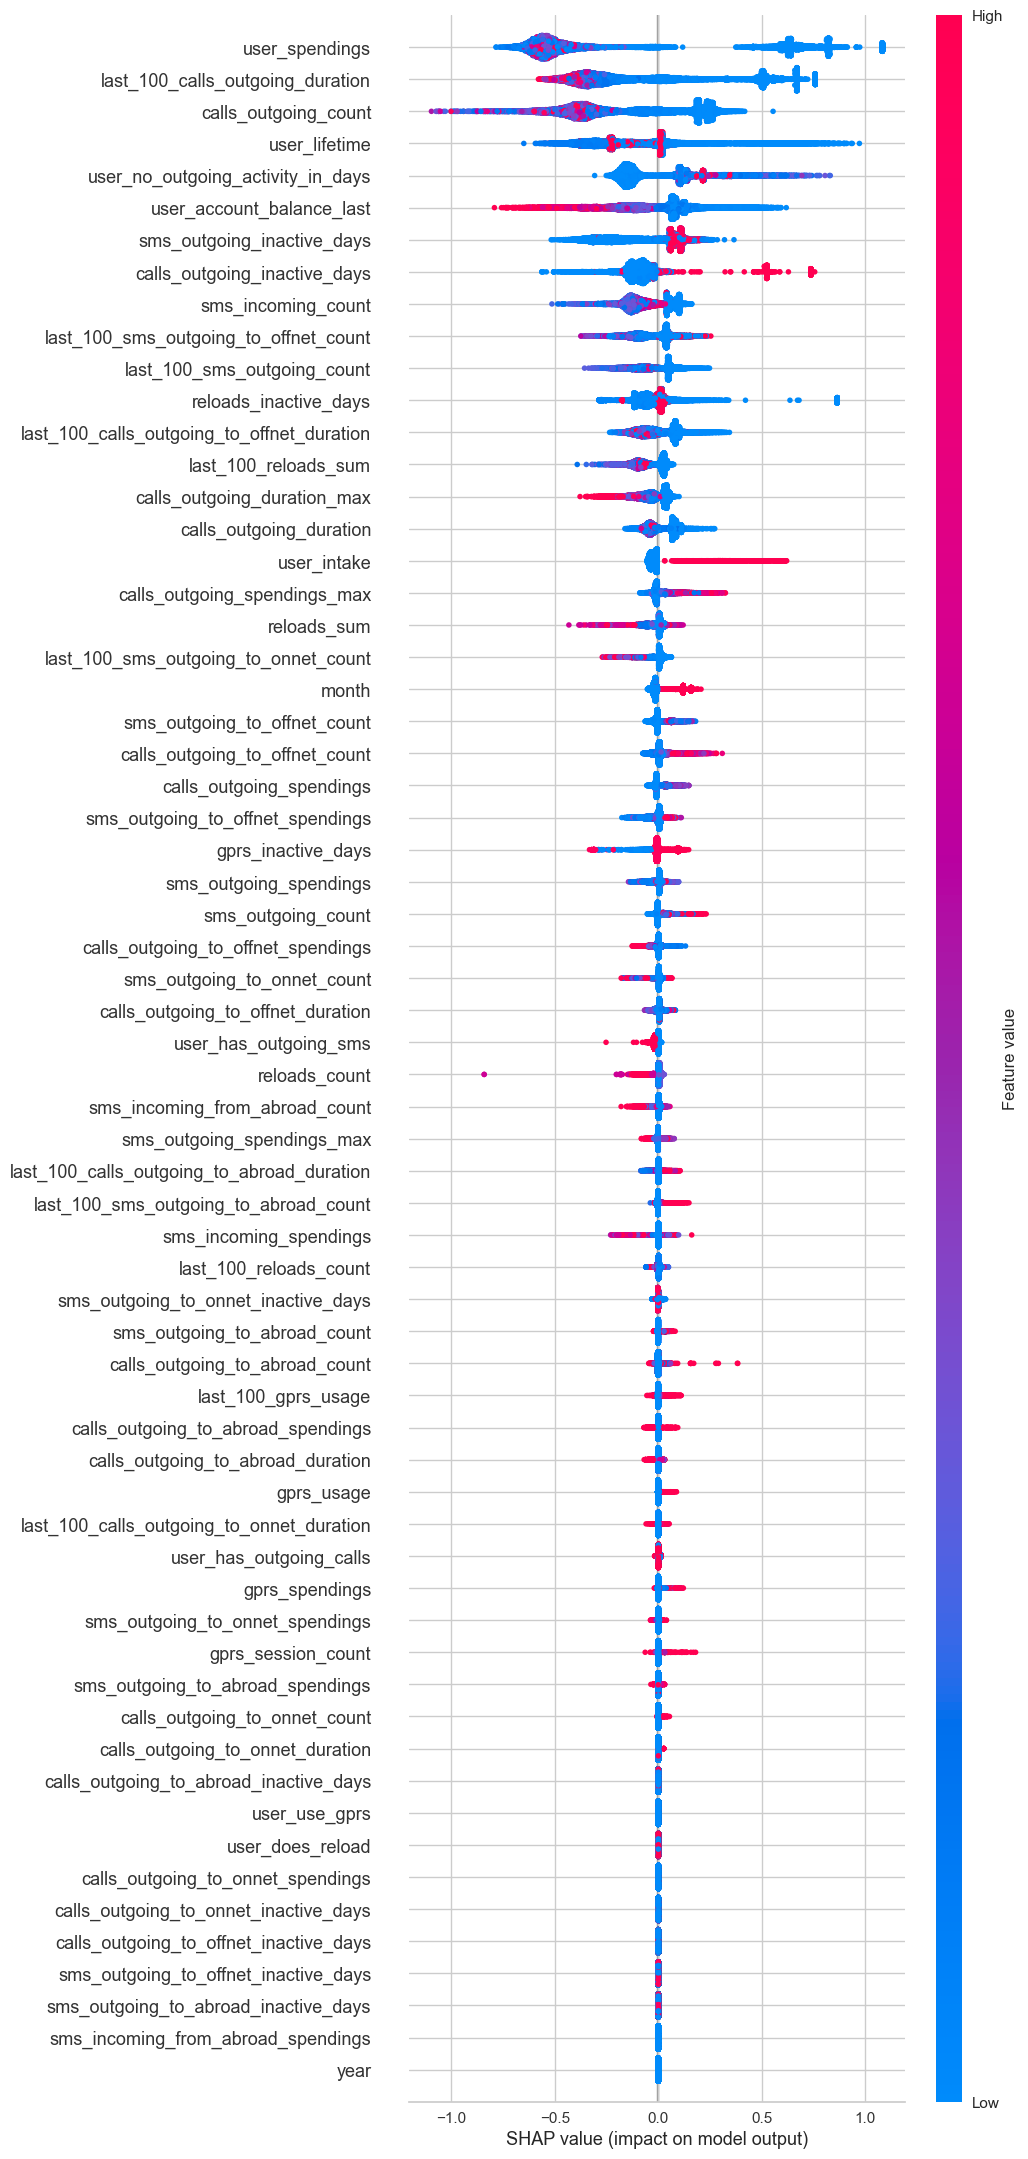
shap.plots.beeswarm(vals, max_display=100)
feature_importances
year                                      0.000000
sms_incoming_from_abroad_spendings        0.000000
sms_outgoing_to_abroad_inactive_days      0.000000
sms_outgoing_to_offnet_inactive_days      0.000000
calls_outgoing_to_offnet_inactive_days    0.000000
                                            ...
user_intake                               0.026111
calls_outgoing_duration                   0.030865
calls_outgoing_inactive_days              0.038314
last_100_calls_outgoing_duration          0.136882
user_spendings                            0.316150
Length: 64, dtype: float32
Constraints
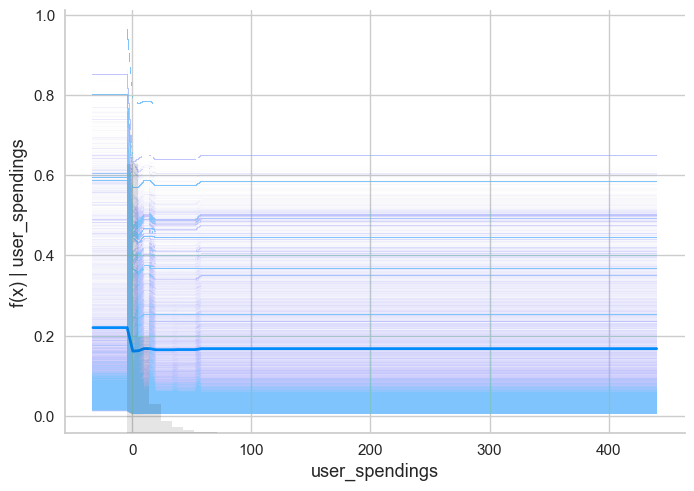
shap.plots.partial_dependence(ind='user_spendings',
                              model=lambda rows: xg_step.predict_proba(rows)[:,-1],
                              data=X_train)
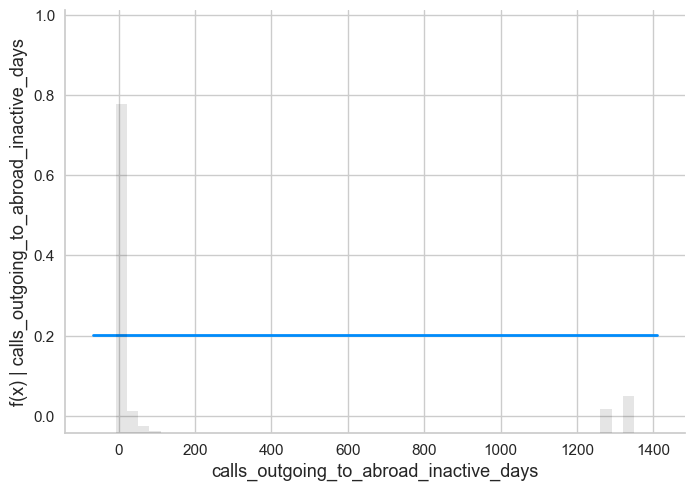
shap.plots.partial_dependence(ind='calls_outgoing_to_abroad_inactive_days',
                              model=lambda rows: xg_step.predict_proba(rows)[:,-1],
                              data=X_train)
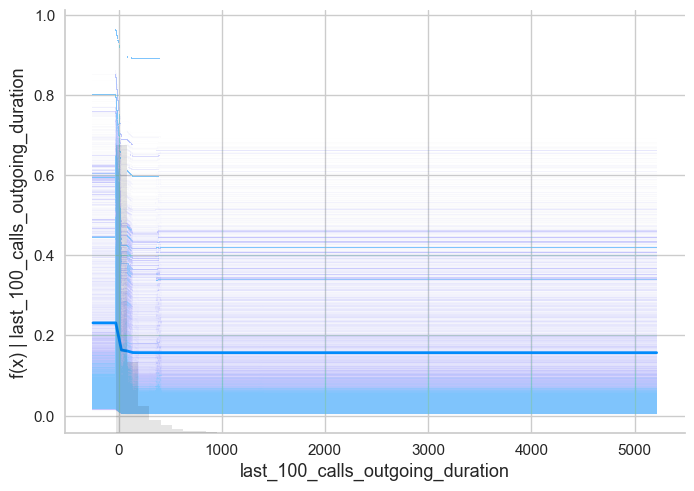
shap.plots.partial_dependence(ind='last_100_calls_outgoing_duration',
                              model=lambda rows: xg_step.predict_proba(rows)[:,-1],
                              data=X_train)
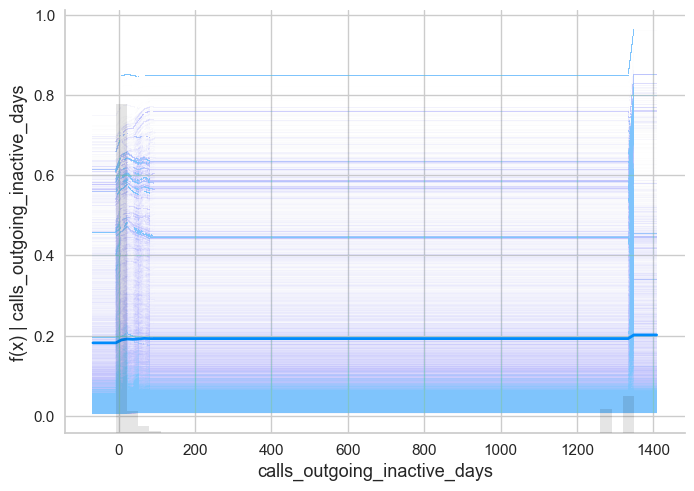
shap.plots.partial_dependence(ind='calls_outgoing_inactive_days',
                              model=lambda rows: xg_step.predict_proba(rows)[:,-1],
                              data=X_train)
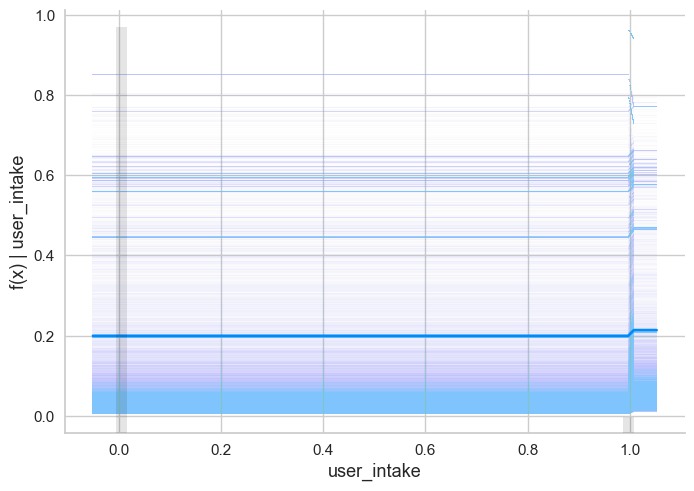
shap.plots.partial_dependence(ind='user_intake',
                              model=lambda rows: xg_step.predict_proba(rows)[:,-1],
                              data=X_train)
import xgboost as xgb

xg_const = xgb.XGBClassifier(**step_params, early_stopping_rounds=20,
                             monotone_constraints={'calls_outgoing_to_abroad_inactive_days': 1,
                                                   'last_100_calls_outgoing_duration': -1,
                                                   'calls_outgoing_inactive_days': -1, 'user_intake': -1,
                                                   "user_spendings": -1})
xg_const.fit(X_train, y_train, eval_set=[(X_train, y_train),
                                         (X_test, y_test)],
             verbose=100)
xg_const.score(X_test, y_test)
[0]	validation_0-aucpr:0.72500	validation_1-aucpr:0.71750
[99]	validation_0-aucpr:0.77979	validation_1-aucpr:0.76136


0.8765796124684078
xg_const = xgb.XGBClassifier(**step_params, early_stopping_rounds=20,
                             n_estimators=200,
                             monotone_constraints={'calls_outgoing_to_abroad_inactive_days': 1,
                                                   'last_100_calls_outgoing_duration': -1,
                                                   'calls_outgoing_inactive_days': -1, 'user_intake': -1,
                                                   "user_spendings": -1})
xg_const.fit(X_train, y_train, eval_set=[(X_train, y_train),
                                         (X_test, y_test)],
             verbose=100)
xg_const.score(X_test, y_test)
[0]	validation_0-aucpr:0.72500	validation_1-aucpr:0.71750
[100]	validation_0-aucpr:0.77987	validation_1-aucpr:0.76135
[111]	validation_0-aucpr:0.78168	validation_1-aucpr:0.76126


0.8765796124684078
from sklearn import metrics
metrics.roc_auc_score(y_test, xg_const.predict(X_test))
0.7917795192196179
xg_step.score(X_test, y_test)
0.8762185581899146
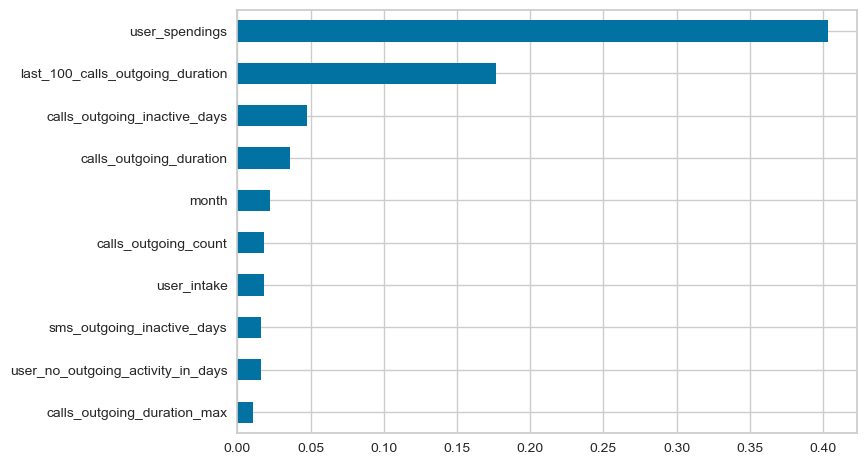
(pd.Series(xg_step.feature_importances_, index=X_train.columns)
 .sort_values()
 .iloc[-10:]
 .plot.barh()
 )
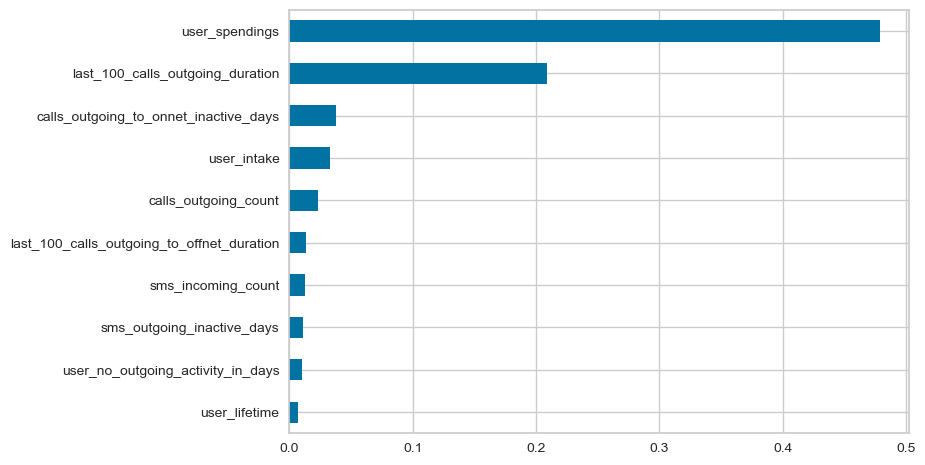
<Axes: >
(pd.Series(xg_const.feature_importances_, index=X_train.columns)
 .sort_values()
 .iloc[-10:]
 .plot.barh()
 )
<Axes: >
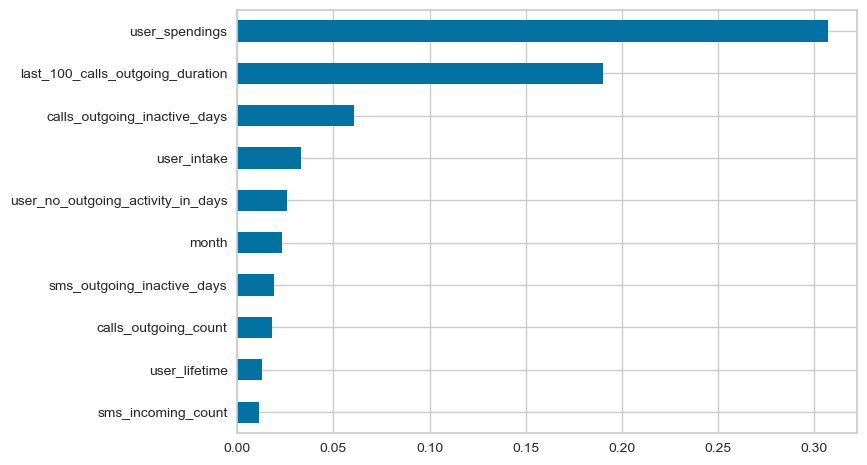
import xgboost as xgb
xg = xgb.XGBClassifier()
xg.fit(X_train, y_train)
xg.score(X_test, y_test)
0.8762185581899146
(pd.Series(xg.feature_importances_, index=X_train.columns)
 .sort_values()
 .iloc[-10:]
 .plot.barh()
 )
<Axes: >
Deployment
Ys = data["churn"]
Xs = data.drop("churn",axis=1)
step_params = {'random_state': 42,
               'eval_metric': 'aucpr',
               'max_depth': 7,
               'min_child_weight': 0.4180116655186252,
               'scale_pos_weight': 0.9905218835879426,
               'max_delta_step': 4.116066988118725,
               'subsample': 0.9368886996127623,
               'colsample_bytree': 0.647742541625645,
               'reg_alpha': 2.620031077025826,
               'reg_lambda': 3.2023850771623024,
               'gamma': 0.0010860710789745316,
               'learning_rate': 0.2684672626409679}


xg_const = xgb.XGBClassifier(**step_params,
                             monotone_constraints={'calls_outgoing_to_abroad_inactive_days': 1,
                                                   'last_100_calls_outgoing_duration': -1,
                                                   'calls_outgoing_inactive_days': -1,
                                                   'user_intake': -1,
                                                   "user_spendings": -1})
xg_const.fit(Xs, Ys,verbose=100)
import mlflow
model_info = mlflow.xgboost.log_model(xg_const, artifact_path='artifact')
model_info.run_id
'e7de66e56ade4eb9b29eadaad731941b'
logged_model = 'mlruns/0/1cdf9ce7481b40d79408b5c23c0e700d/artifacts/artifact'
loaded_model = mlflow.pyfunc.load_model(logged_model)
loaded_model.predict(X_test)
array([0, 0, 0, ..., 0, 0, 0])